Investigate a cost spike in five minutes
You run the cloud bill at Northwind Labs (a fictional company), and an email says Amazon EC2 cost $669 more than expected on 23 October. In five minutes you will know which instances caused it, when they started and stopped costing money, and who to ask about them.
You will use: Cost Anomalies · Cost Explorer · Resource Inventory Time: 5 minutes
1. Open the anomaly
The email links to the console. Or open Cost Management → Cost Anomalies: the list shows the last 90 days, the largest impact first, and the EC2 anomaly is at the top.
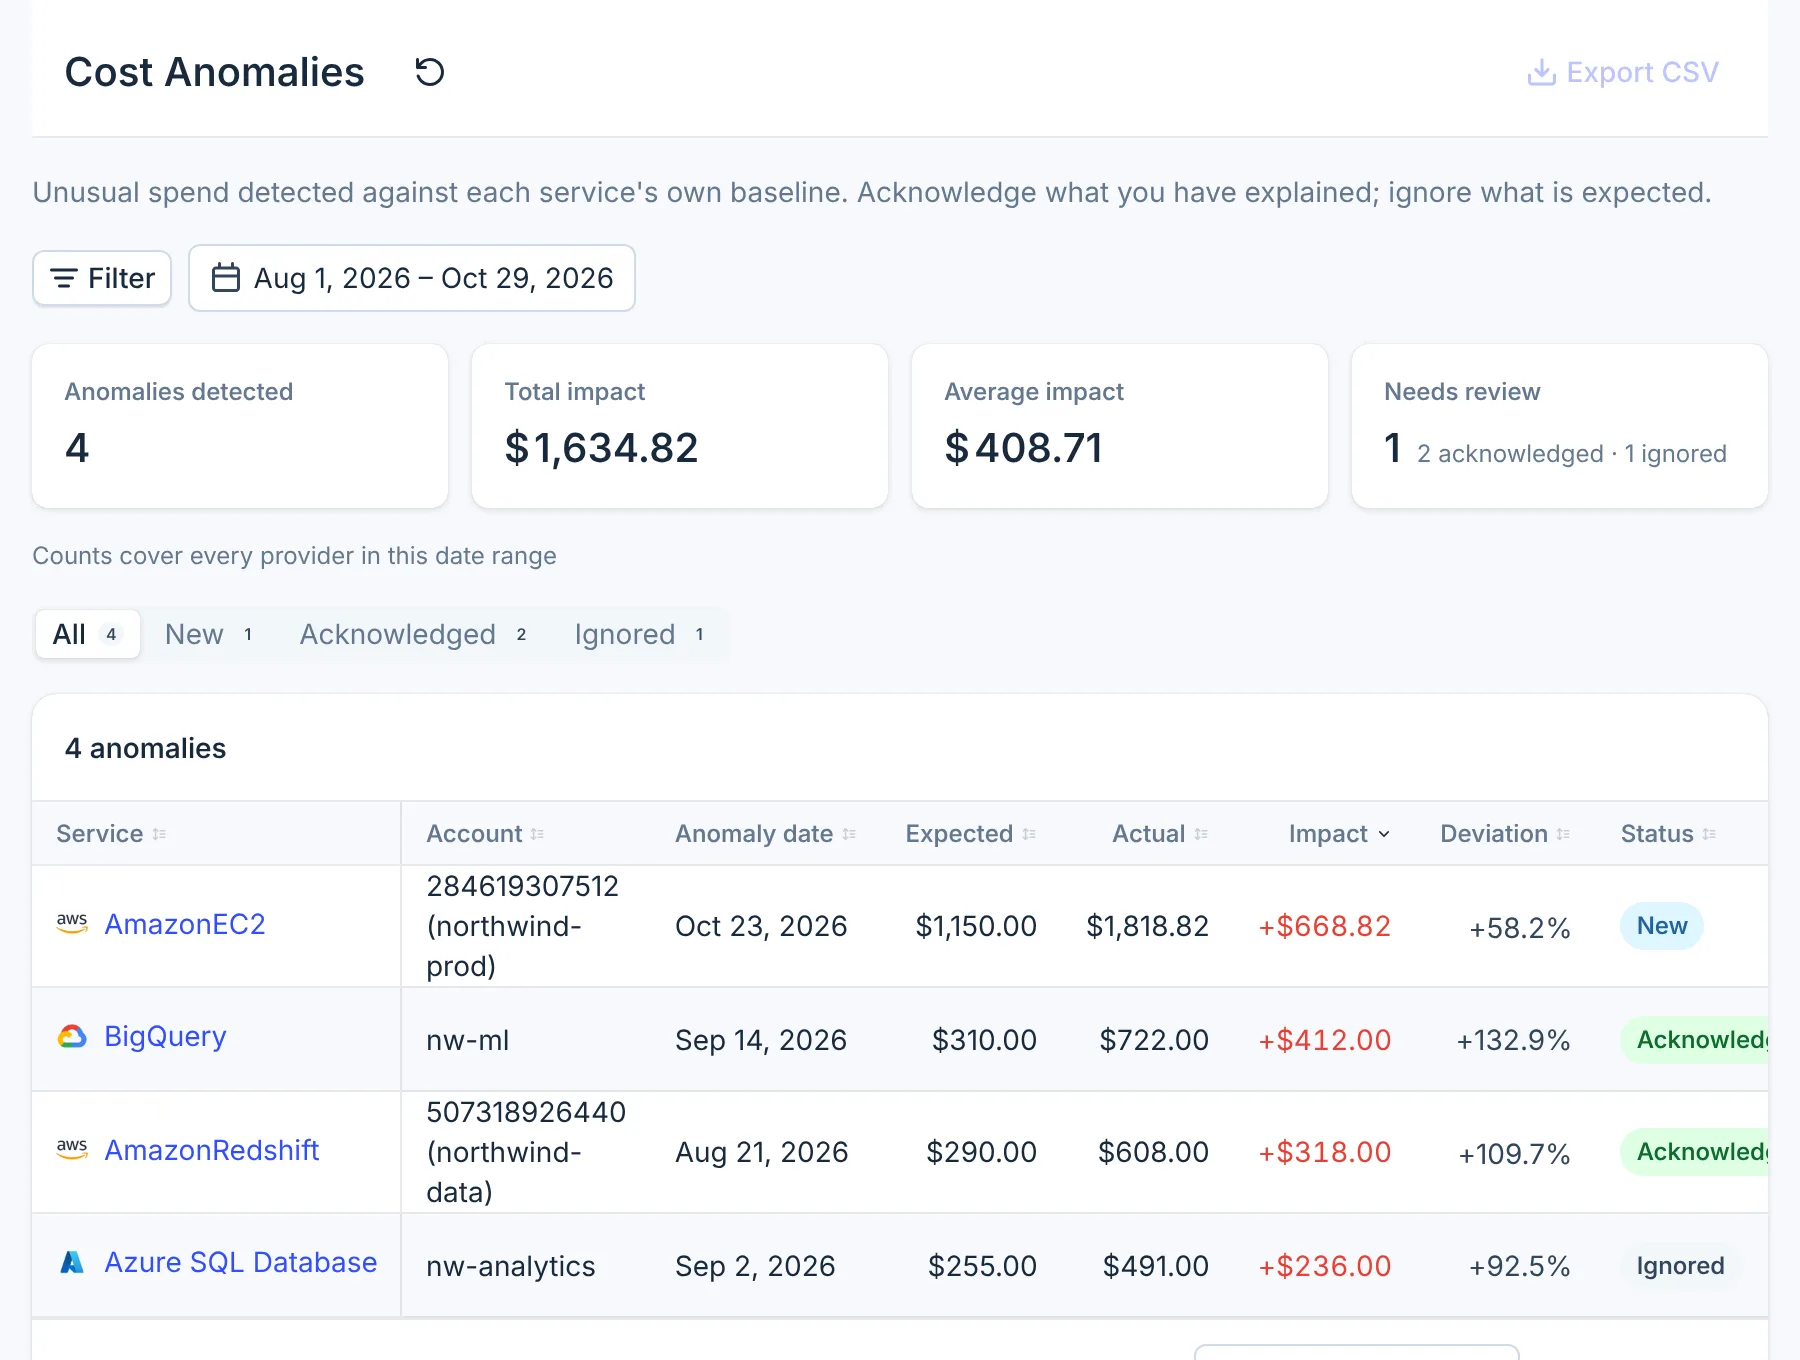
Select AmazonEC2 to open it. Overview shows the expected cost (the service's usual day), the actual cost, and the daily cost around the date. Root cause names the primary cause and the top contributing resource, and splits that day's cost by usage type, region and operation.
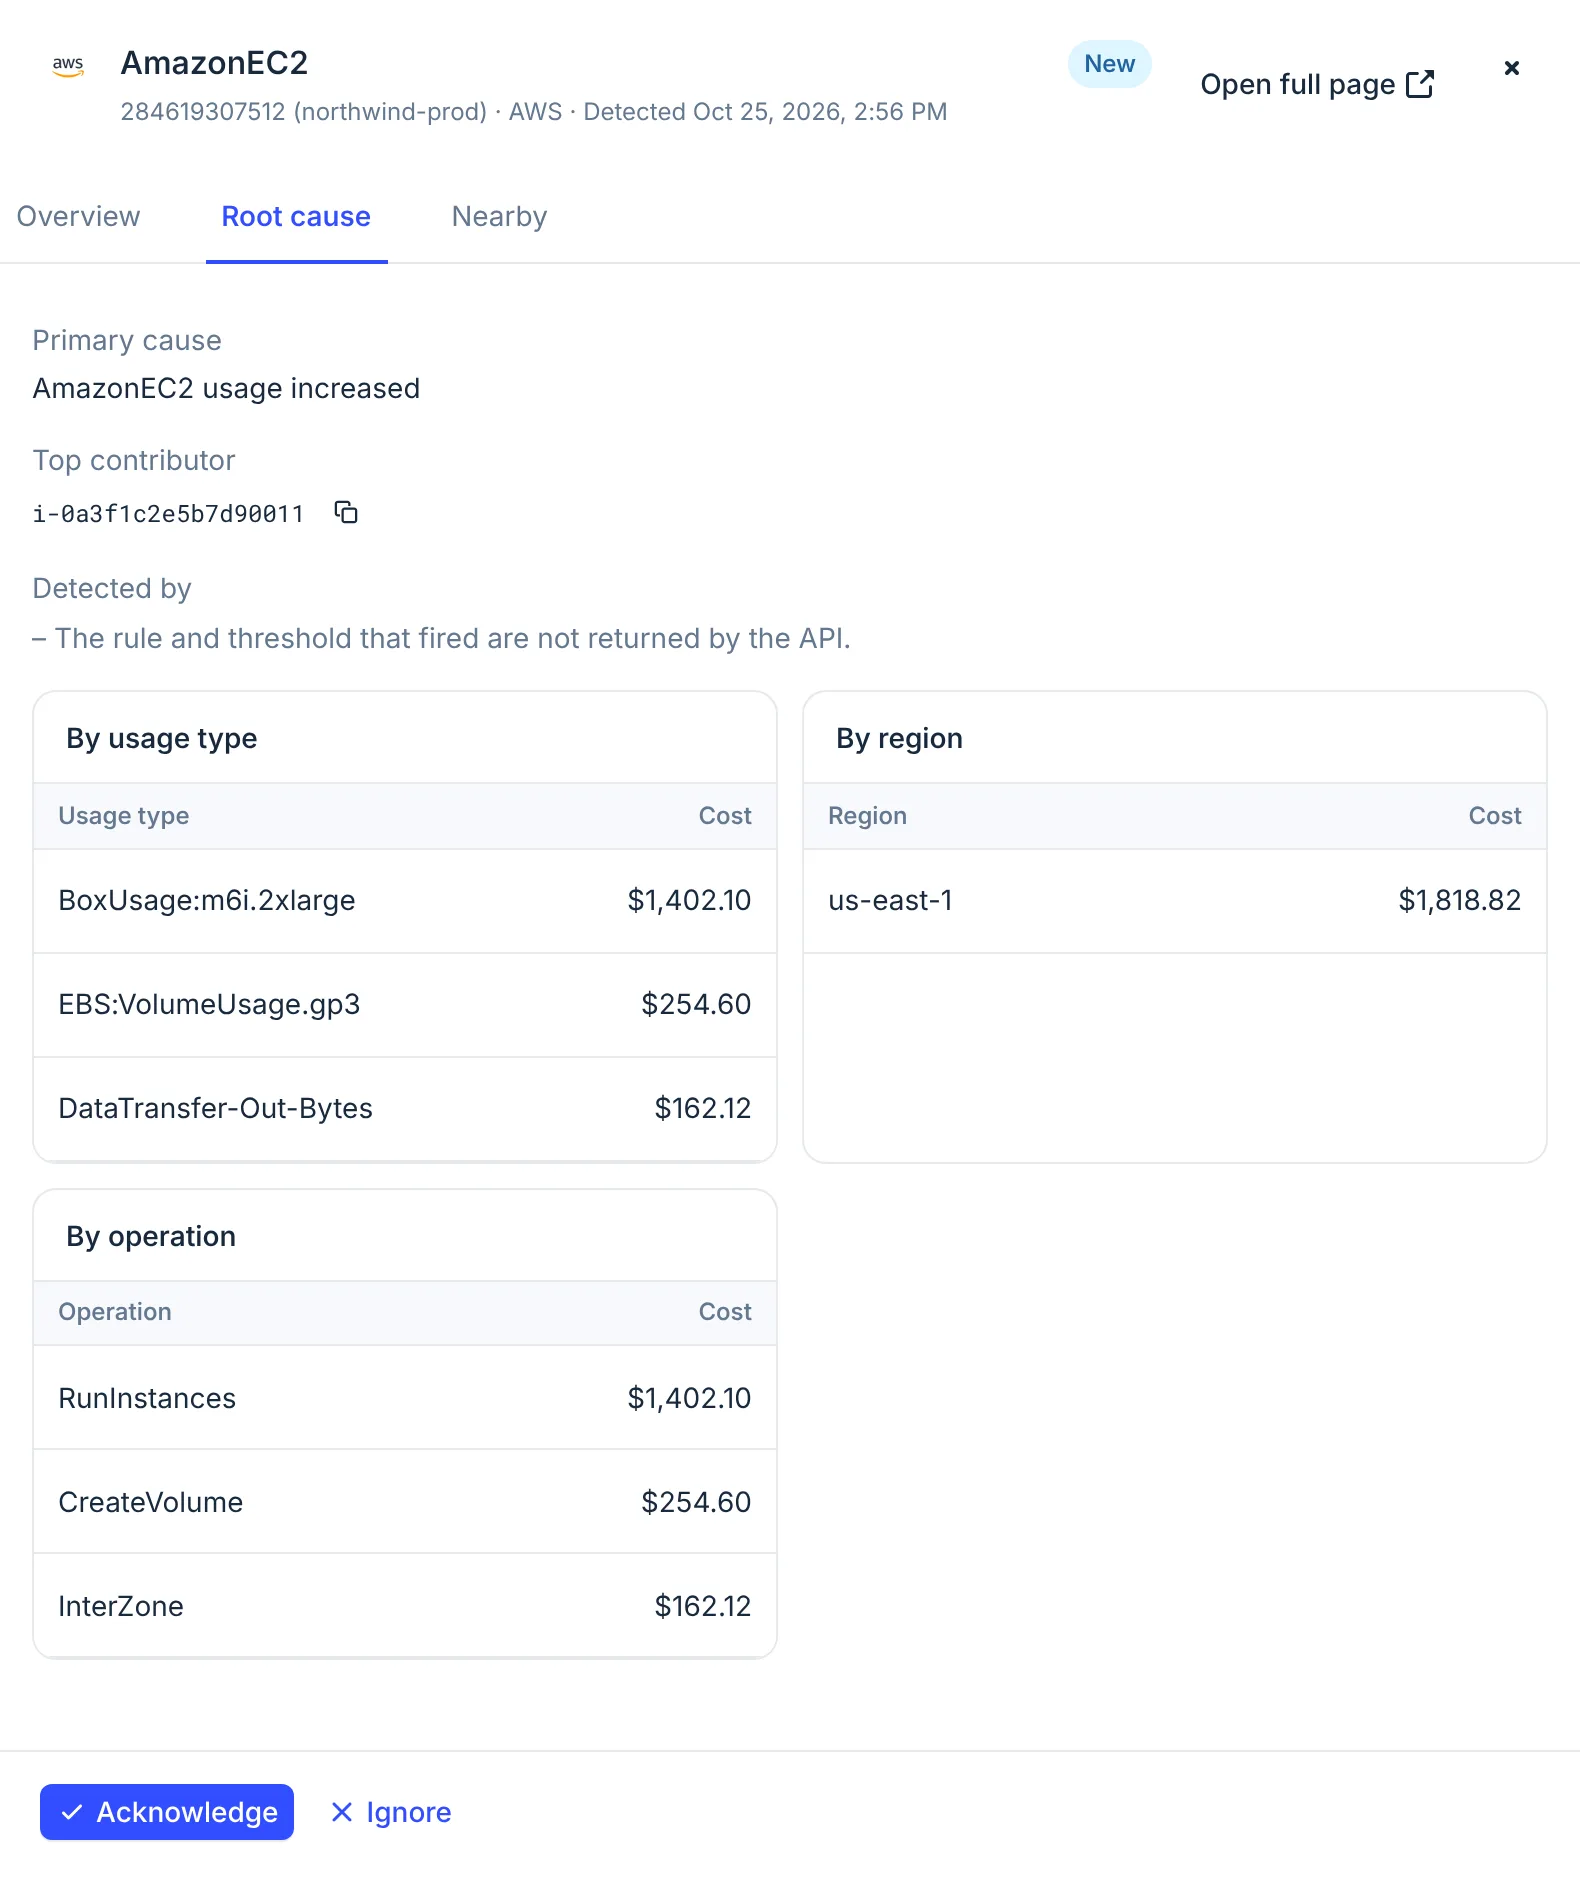
Anomalies are checked once a day for the day two days earlier, so the alert arrives about two days after the spend started. Check whether the spike is still running before you go further.
2. See how long it ran
Open Cost Management → Cost Explorer and set the period to a few days either side of the anomaly. Filter to the account from the anomaly, open Group by, tick Service and select Apply.
In Breakdown, Amazon Elastic Compute Cloud is first and open. Its resources are listed with their
cost for each day, largest first. Three ingest-loadtest instances sit at the top: $0.00 on 22 October,
then over $900 a day each.
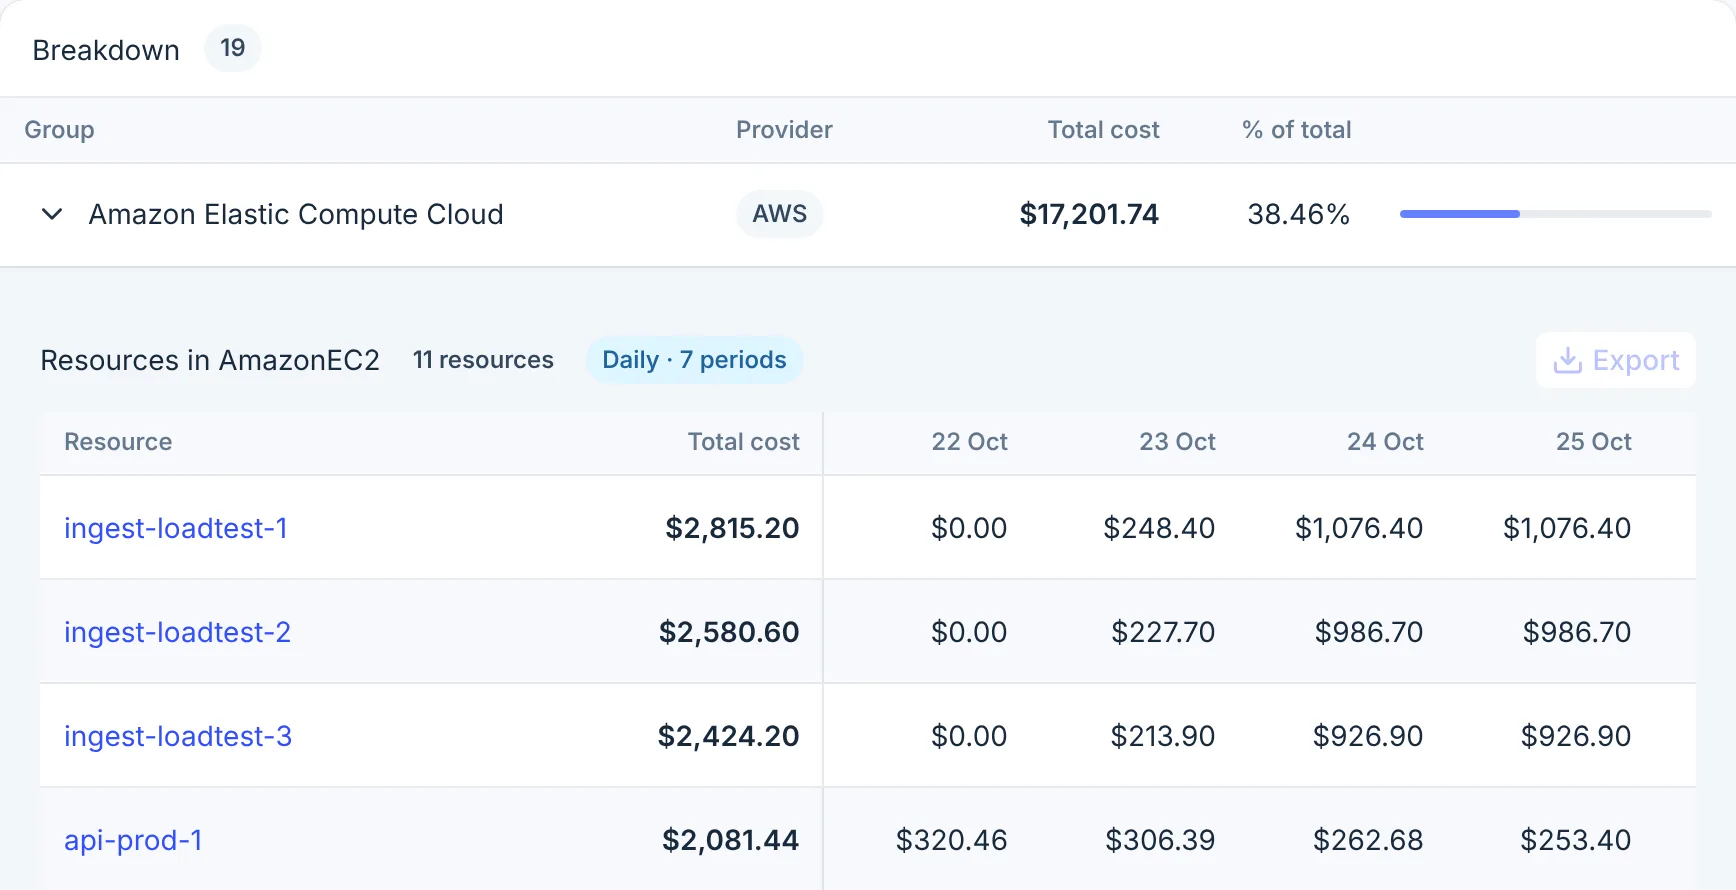
- Group row
- Resource
Select ingest-loadtest-1. Its Costs tab shows each day it was billed: nothing on 22 October, about
$1,076 on each of 24 and 25 October, and nothing again from 27 October. The load test ran over the
weekend and was stopped on Monday.
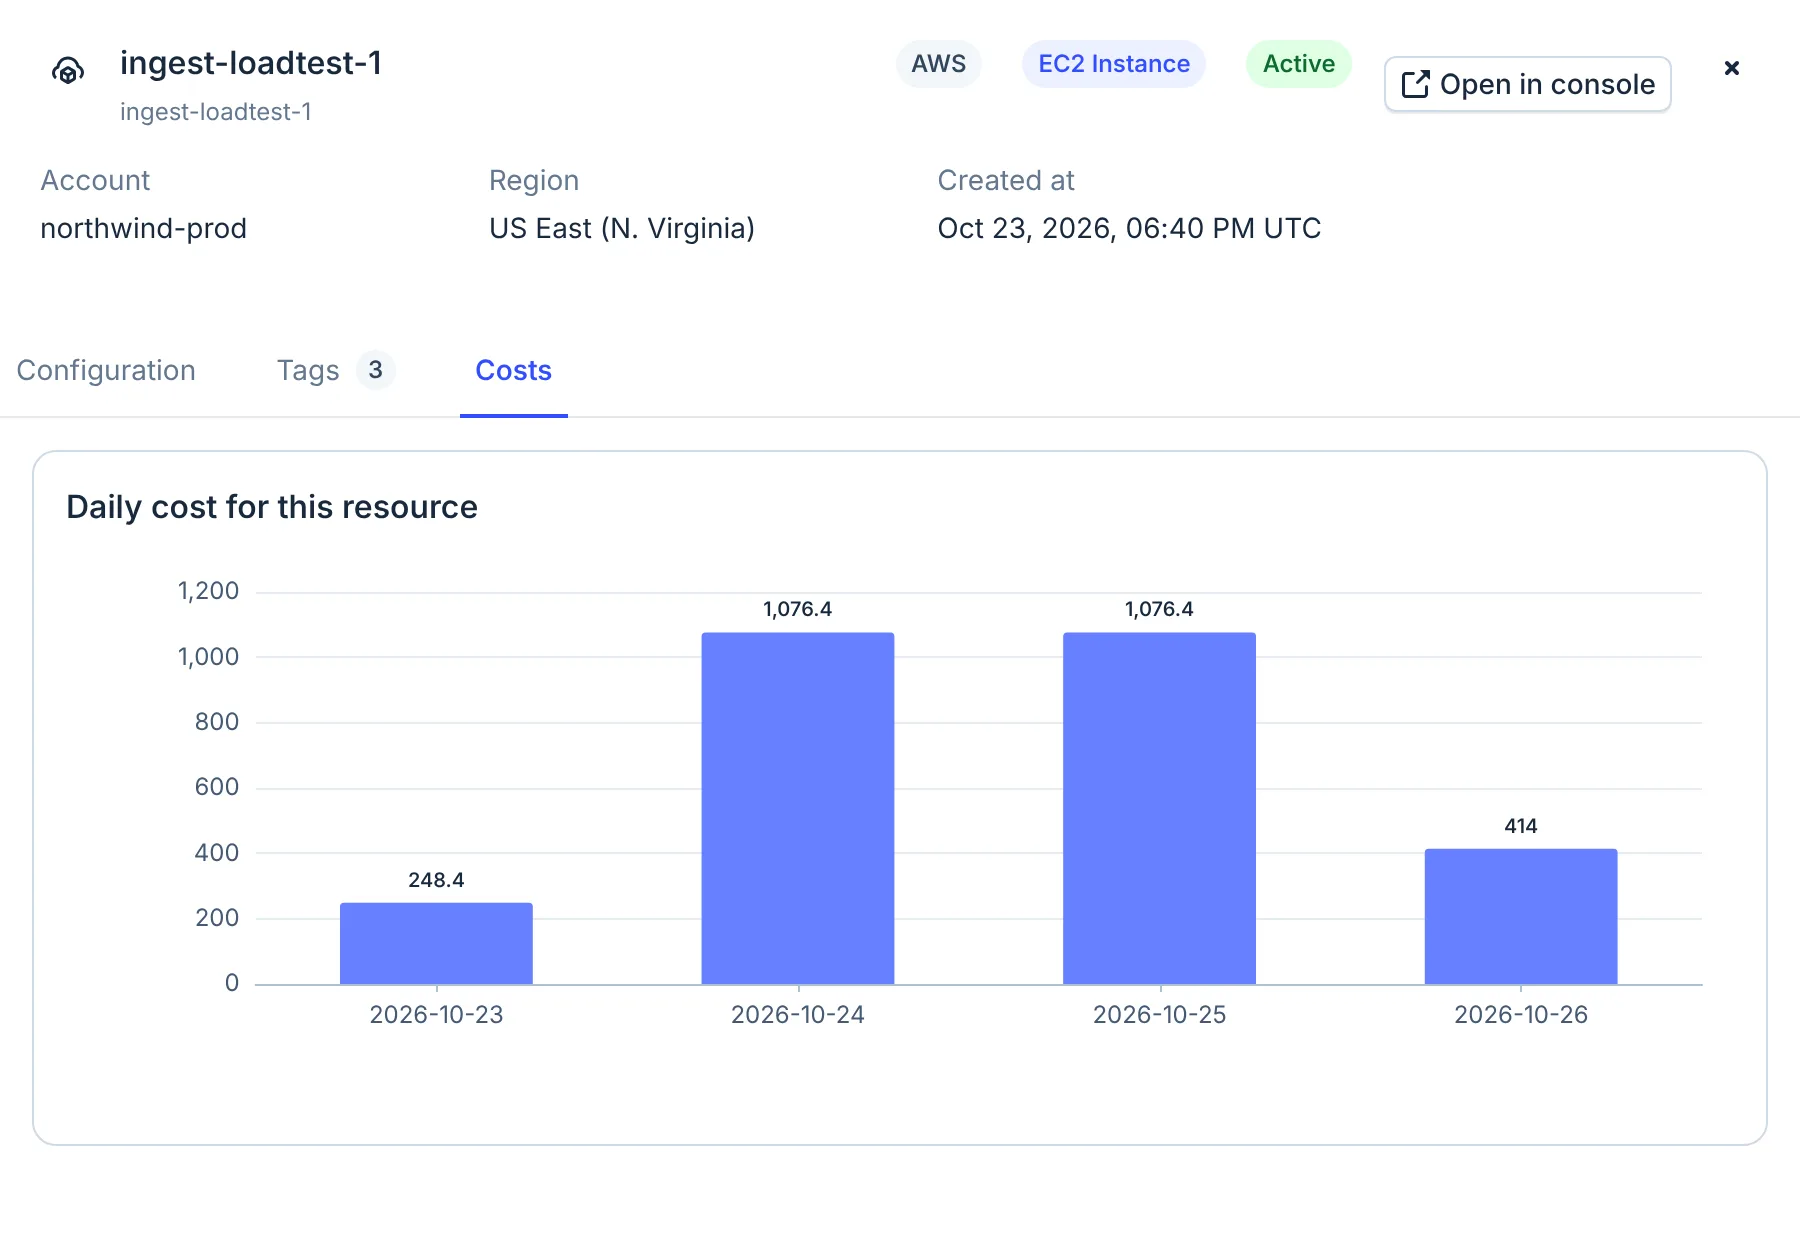
- Costs tab
3. Find who owns it
Open the instance in Resource Inventory (Cost Management → Resource Inventory, then search for
its name). The Tags tab shows its team and owner tags, if it has them; that is who to ask.
For a Google Cloud or Microsoft Azure resource, the Configuration tab also lists earlier versions, so you can see a size or setting that changed. For AWS, CloudYali keeps the current configuration only: to see who changed or started an AWS resource, check AWS CloudTrail.
4. Close the anomaly
Back in Cost Anomalies, select Acknowledge once you know the cause, or Ignore if the spend was expected. The anomaly leaves Needs review, and the next one starts at the top of the list.
What you have now
- The service, the account and the three instances behind the $669.
- The days they cost money, and that they have stopped.
- The team to talk to, from the resource's tags.
Do this every week
Open Cost Anomalies once a week and clear Needs review. Anomaly alerts go only to your organization's signup email address, so agree who reads that inbox.