Dashboard
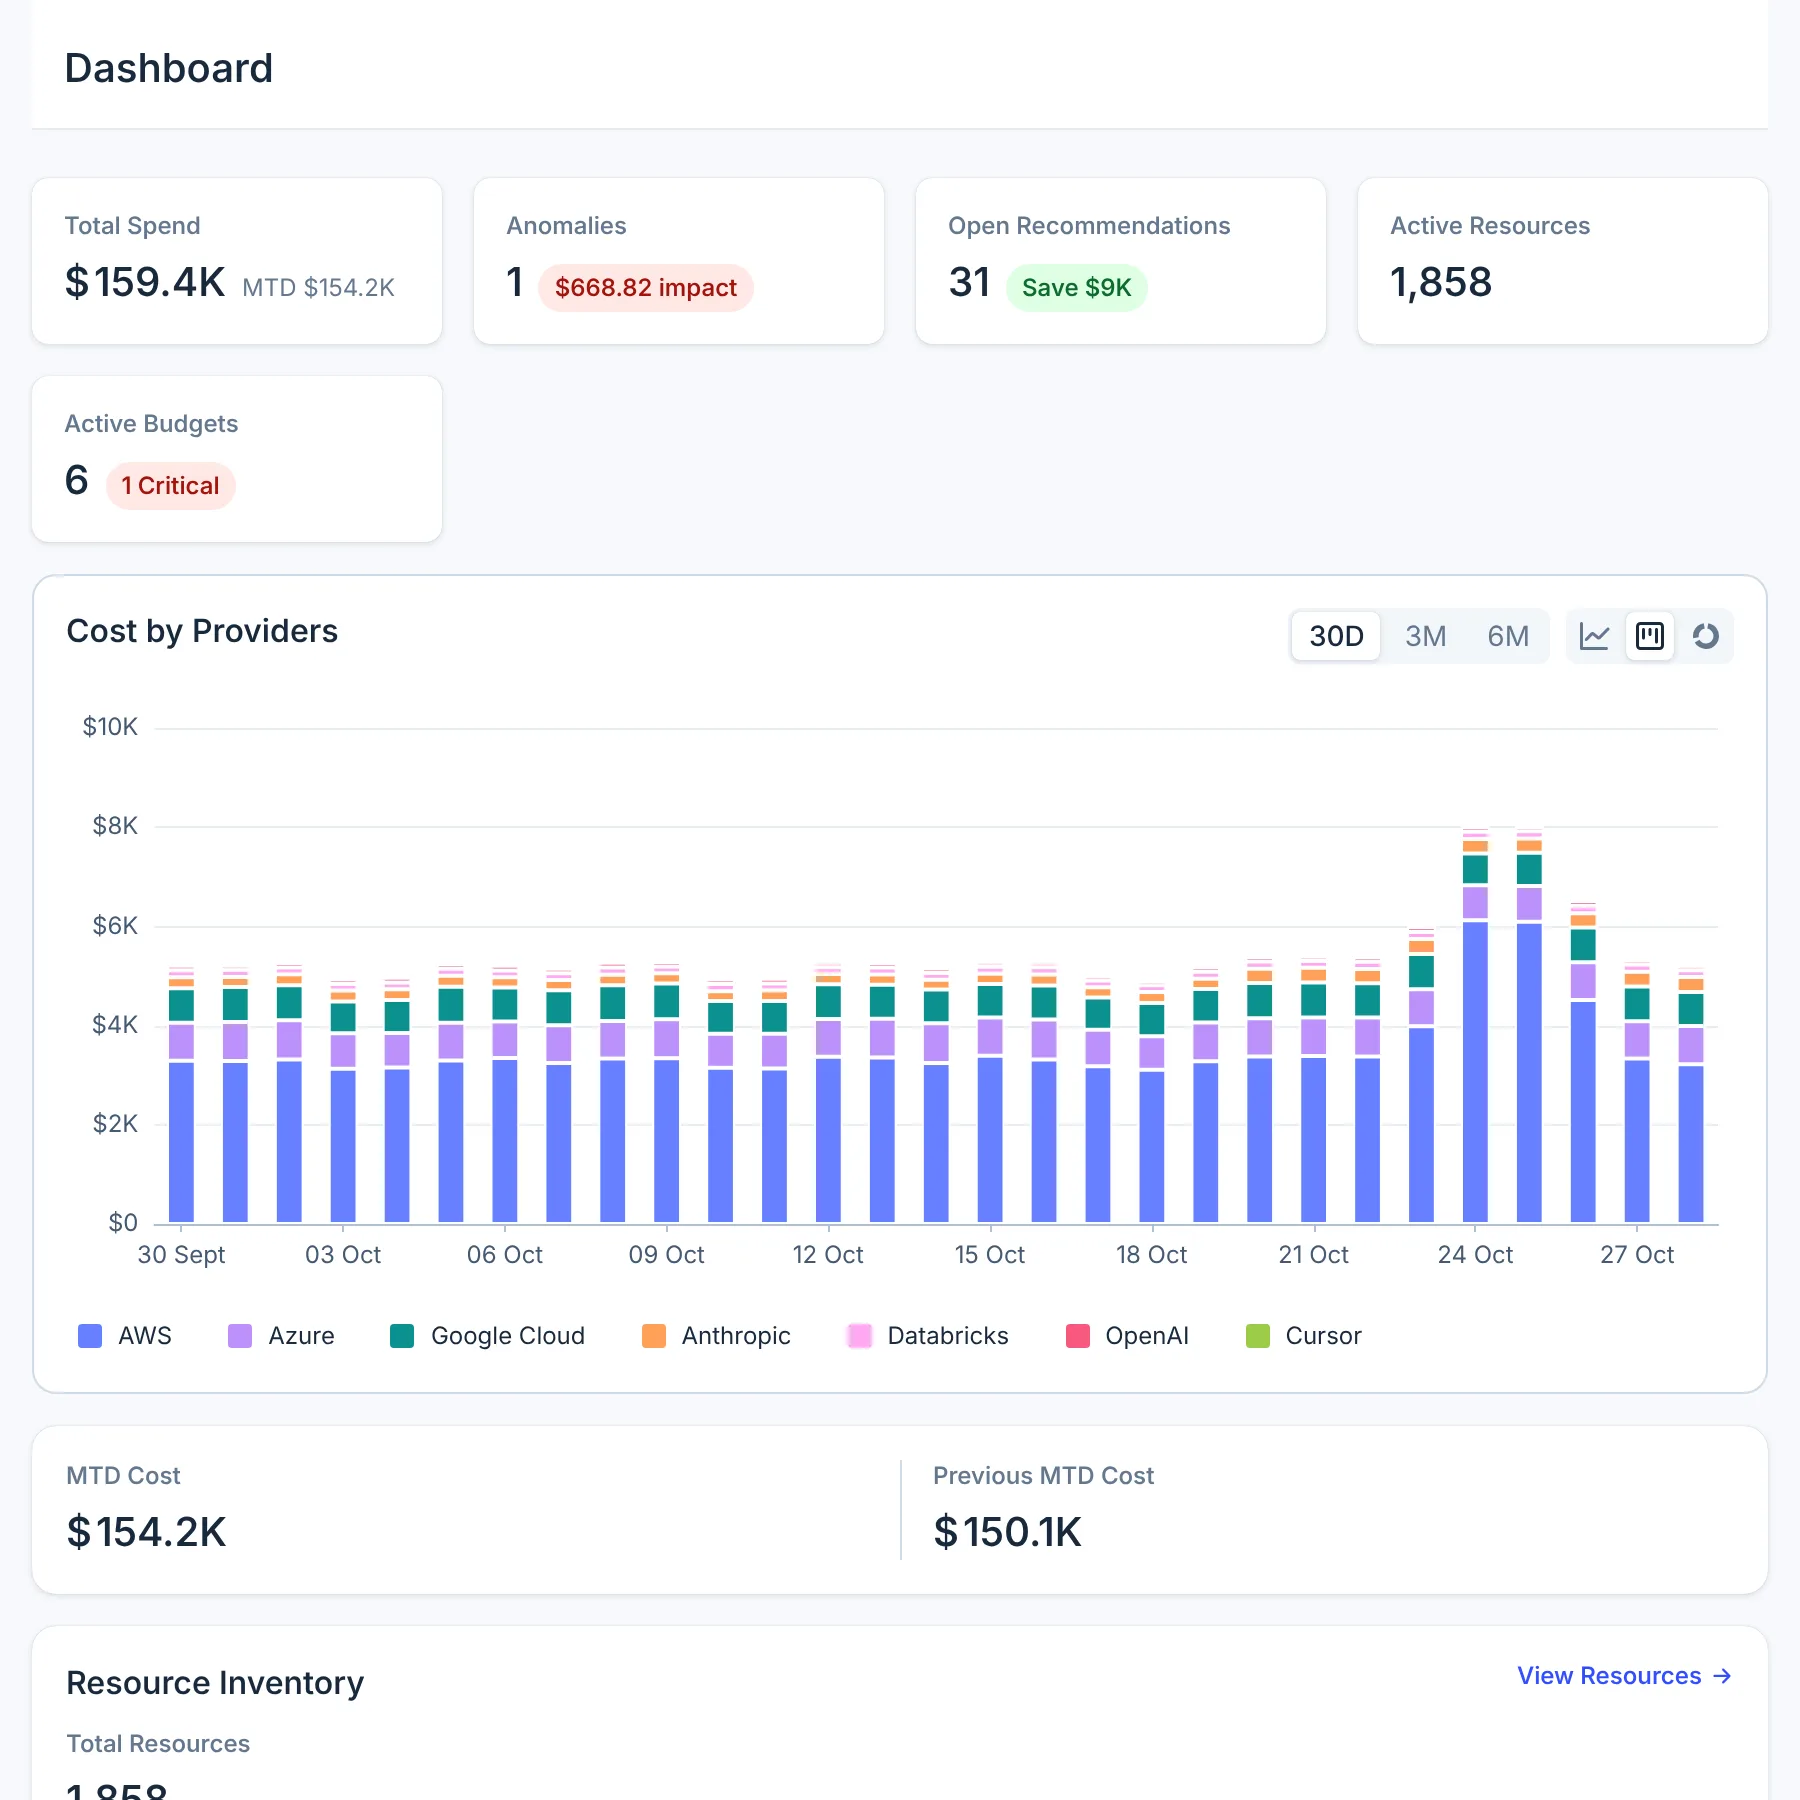
The Dashboard is the first page of the CloudYali console: one screen with your spend across every connected provider, the anomalies CloudYali found, your open savings, your resources and your budgets. Open it from Dashboard at the top of the left navigation.
What you can do
- See total spend across all providers for the last 30 days, 3 months or 6 months.
- Compare this month's spend so far with the same days last month.
- See how many anomalies CloudYali found, and their cost impact.
- See your open savings opportunities and what they would save each month.
- Jump to Resource Inventory, Budgets, Tag Governance and Cost Savings.
Why it matters
Without the Dashboard, checking spend means opening the billing page of every cloud and AI tool you use. Check it each morning. If Total Spend and the provider chart look like last week, nothing needs attention. If a bar jumps or the anomaly count rises, open Cost Explorer or Cost Anomalies.
How it works
The Dashboard reads the same data as the rest of the console. Cost comes from each provider's bill, which CloudYali refreshes once a day, so the newest day or two can still change. The page does not refresh on its own; reload it to fetch the latest figures. There are no filters: every figure covers all your connected accounts.
The period switch on Cost by Providers, 30D, 3M or 6M, sets the window for Total Spend, the chart and both anomaly figures. The other figures have their own windows, listed below.
The five tiles
| Tile | What it shows | Window |
|---|---|---|
| Total Spend | Cost across every provider, counted as in Cost Explorer by default: discounts and taxes included, AWS credits and refunds left out. Google Cloud credits and Azure refunds always count. The caption MTD (month to date) shows this month's spend so far | The chart's period, 30 days by default |
| Anomalies | Anomalies CloudYali detected, in any status, and their cost impact: the spend above each one's expected cost | The chart's period |
| Open Recommendations | Savings opportunities that are Identified, Acknowledged or In progress. Save shows what they would save per month | Now |
| Active Resources | Resources CloudYali found that still exist | Now |
| Active Budgets | All your budgets. The Critical badge counts budgets at 90% of their limit or more | Each budget's period |
The tiles are not links. To dig into a figure, use the widget below it or the left navigation.
Cost by Providers
The chart shows cost by provider: daily bars for 30D, monthly bars for 3M and 6M. Choose Stacked bars, Line chart or Pie chart. Select a provider in the legend to hide or show it. For a breakdown by service, account or region, open Cost Explorer.
Widgets
| Widget | Shows | Link |
|---|---|---|
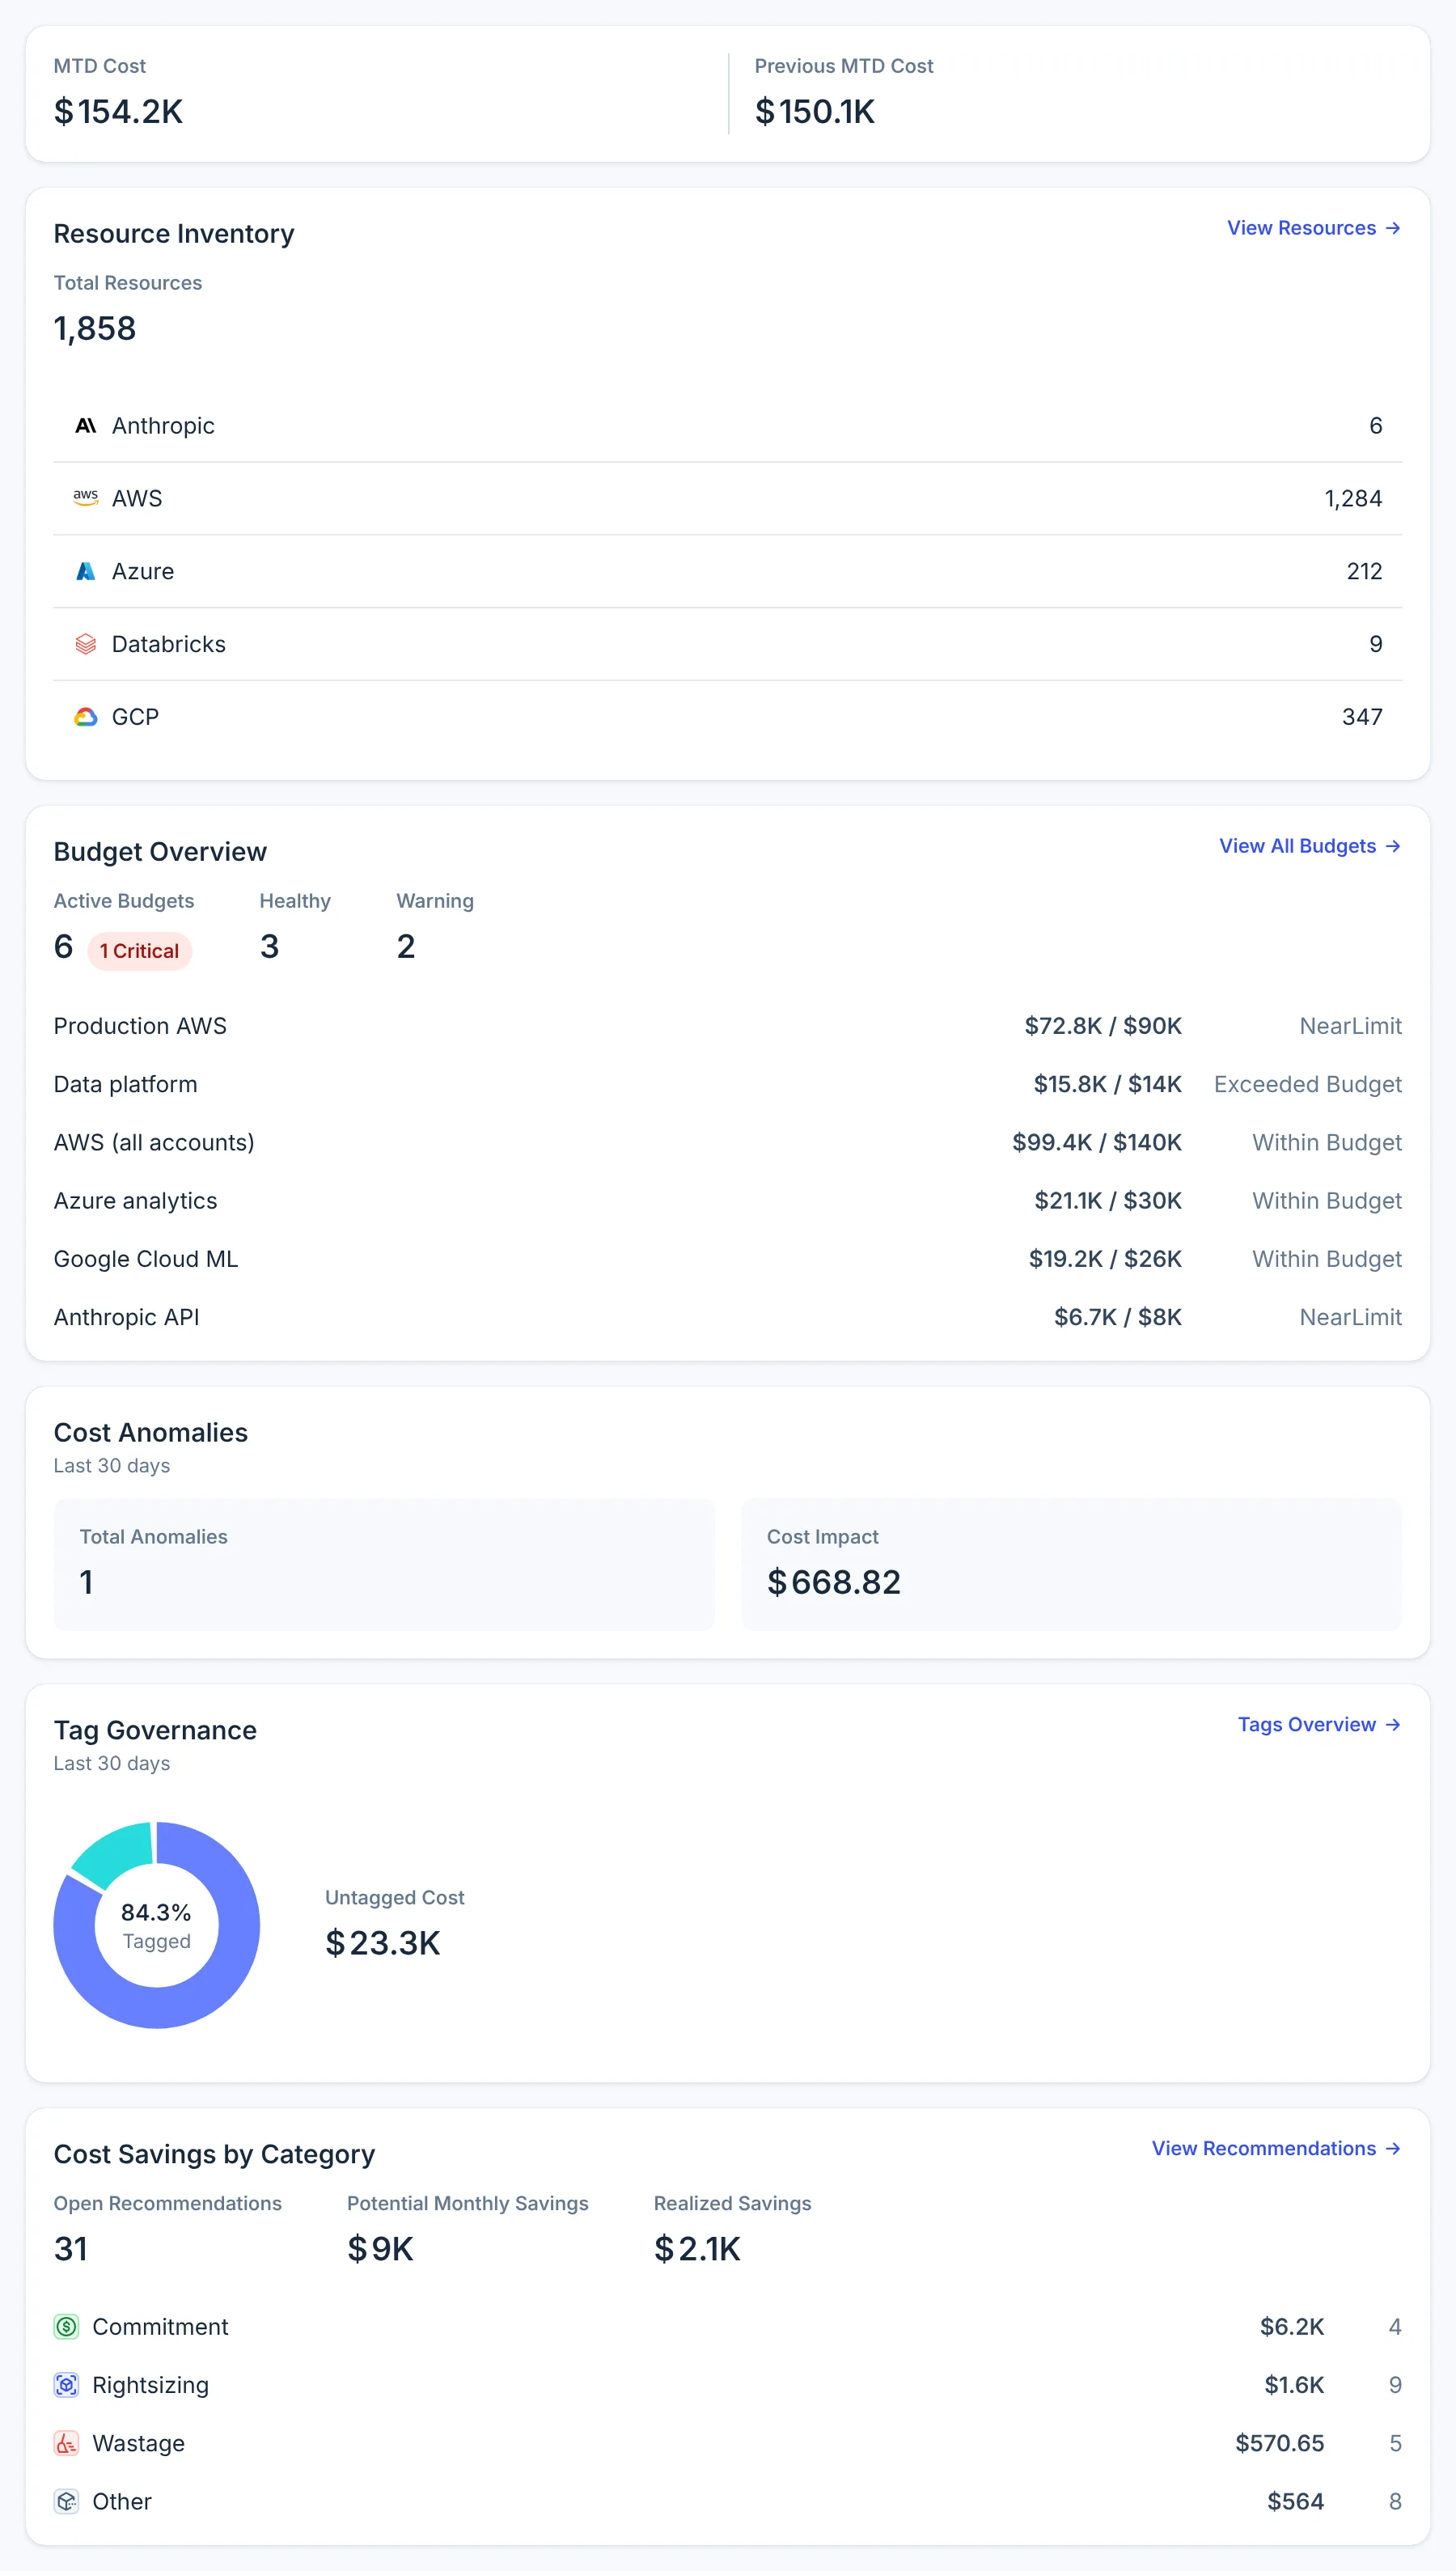
| MTD Cost | This month's spend so far next to Previous MTD Cost, the same days of last month | — |
| Resource Inventory | Total Resources and the count for each provider | View Resources → Resource Inventory |
| Budget Overview | How many budgets are Healthy (under 75% of their limit), Warning (75% to 90%) and Critical, and the first six budgets with their spend, limit and status | View All Budgets → Budgets |
| Cost Anomalies | Total Anomalies and Cost Impact for the chart's period | — |
| Tag Governance | The share of cost that carries tags, and Untagged Cost, for the last 30 days | Tags Overview → Tag Governance |
| Cost Savings by Category | Open Recommendations, Potential Monthly Savings, Realized Savings this month, and savings by category | View Recommendations → Cost Savings |
Supported providers
| Provider | Supported | Notes |
|---|---|---|
| AWS | Yes | AWS credits and refunds are left out of Total Spend |
| Microsoft Azure | Yes | |
| Google Cloud | Yes | |
| Anthropic | Yes | |
| OpenAI | Yes | Cost only; no resources in Resource Inventory |
| Cursor | Yes | Cost only; no resources in Resource Inventory |
| Databricks | Yes | |
| Fastly | Yes |
Limits
- The page has no filters and no custom date range. For either, use Cost Explorer.
- Anomaly detection runs on data from two days ago, so the latest day or two of any period has none.
- Active Budgets counts every budget: a budget has no end date and cannot be paused.
- Each budget row in Budget Overview shows the budget monitor's own status: NearLimit from 80%, Exceeded Budget above 100%. The Warning and Critical counts use 75% and 90%, so a budget can be NearLimit in its row and counted as Warning.
FAQ
Is Total Spend this month's spend?
No. Total Spend covers the period chosen on the Cost by Providers chart, the last 30 days by default. This month's spend so far is the MTD caption under it and the MTD Cost widget.
Why does Total Spend differ from my AWS bill?
Total Spend includes discounts and taxes and leaves out AWS credits and refunds. It also covers a rolling period rather than a calendar month, and the newest day or two can still change.
Does the Anomalies tile count only new anomalies?
No. It counts every anomaly detected in the period, whatever its status, including ones you acknowledged or ignored.
Can I filter the Dashboard by account or provider?
No. The Dashboard always covers all connected accounts. Use Cost Explorer to filter by account, provider, service or tag.
How often does the Dashboard update?
CloudYali refreshes cost, anomalies and budgets once a day. The page itself does not refresh; reload it to fetch the latest figures.