Cost Views
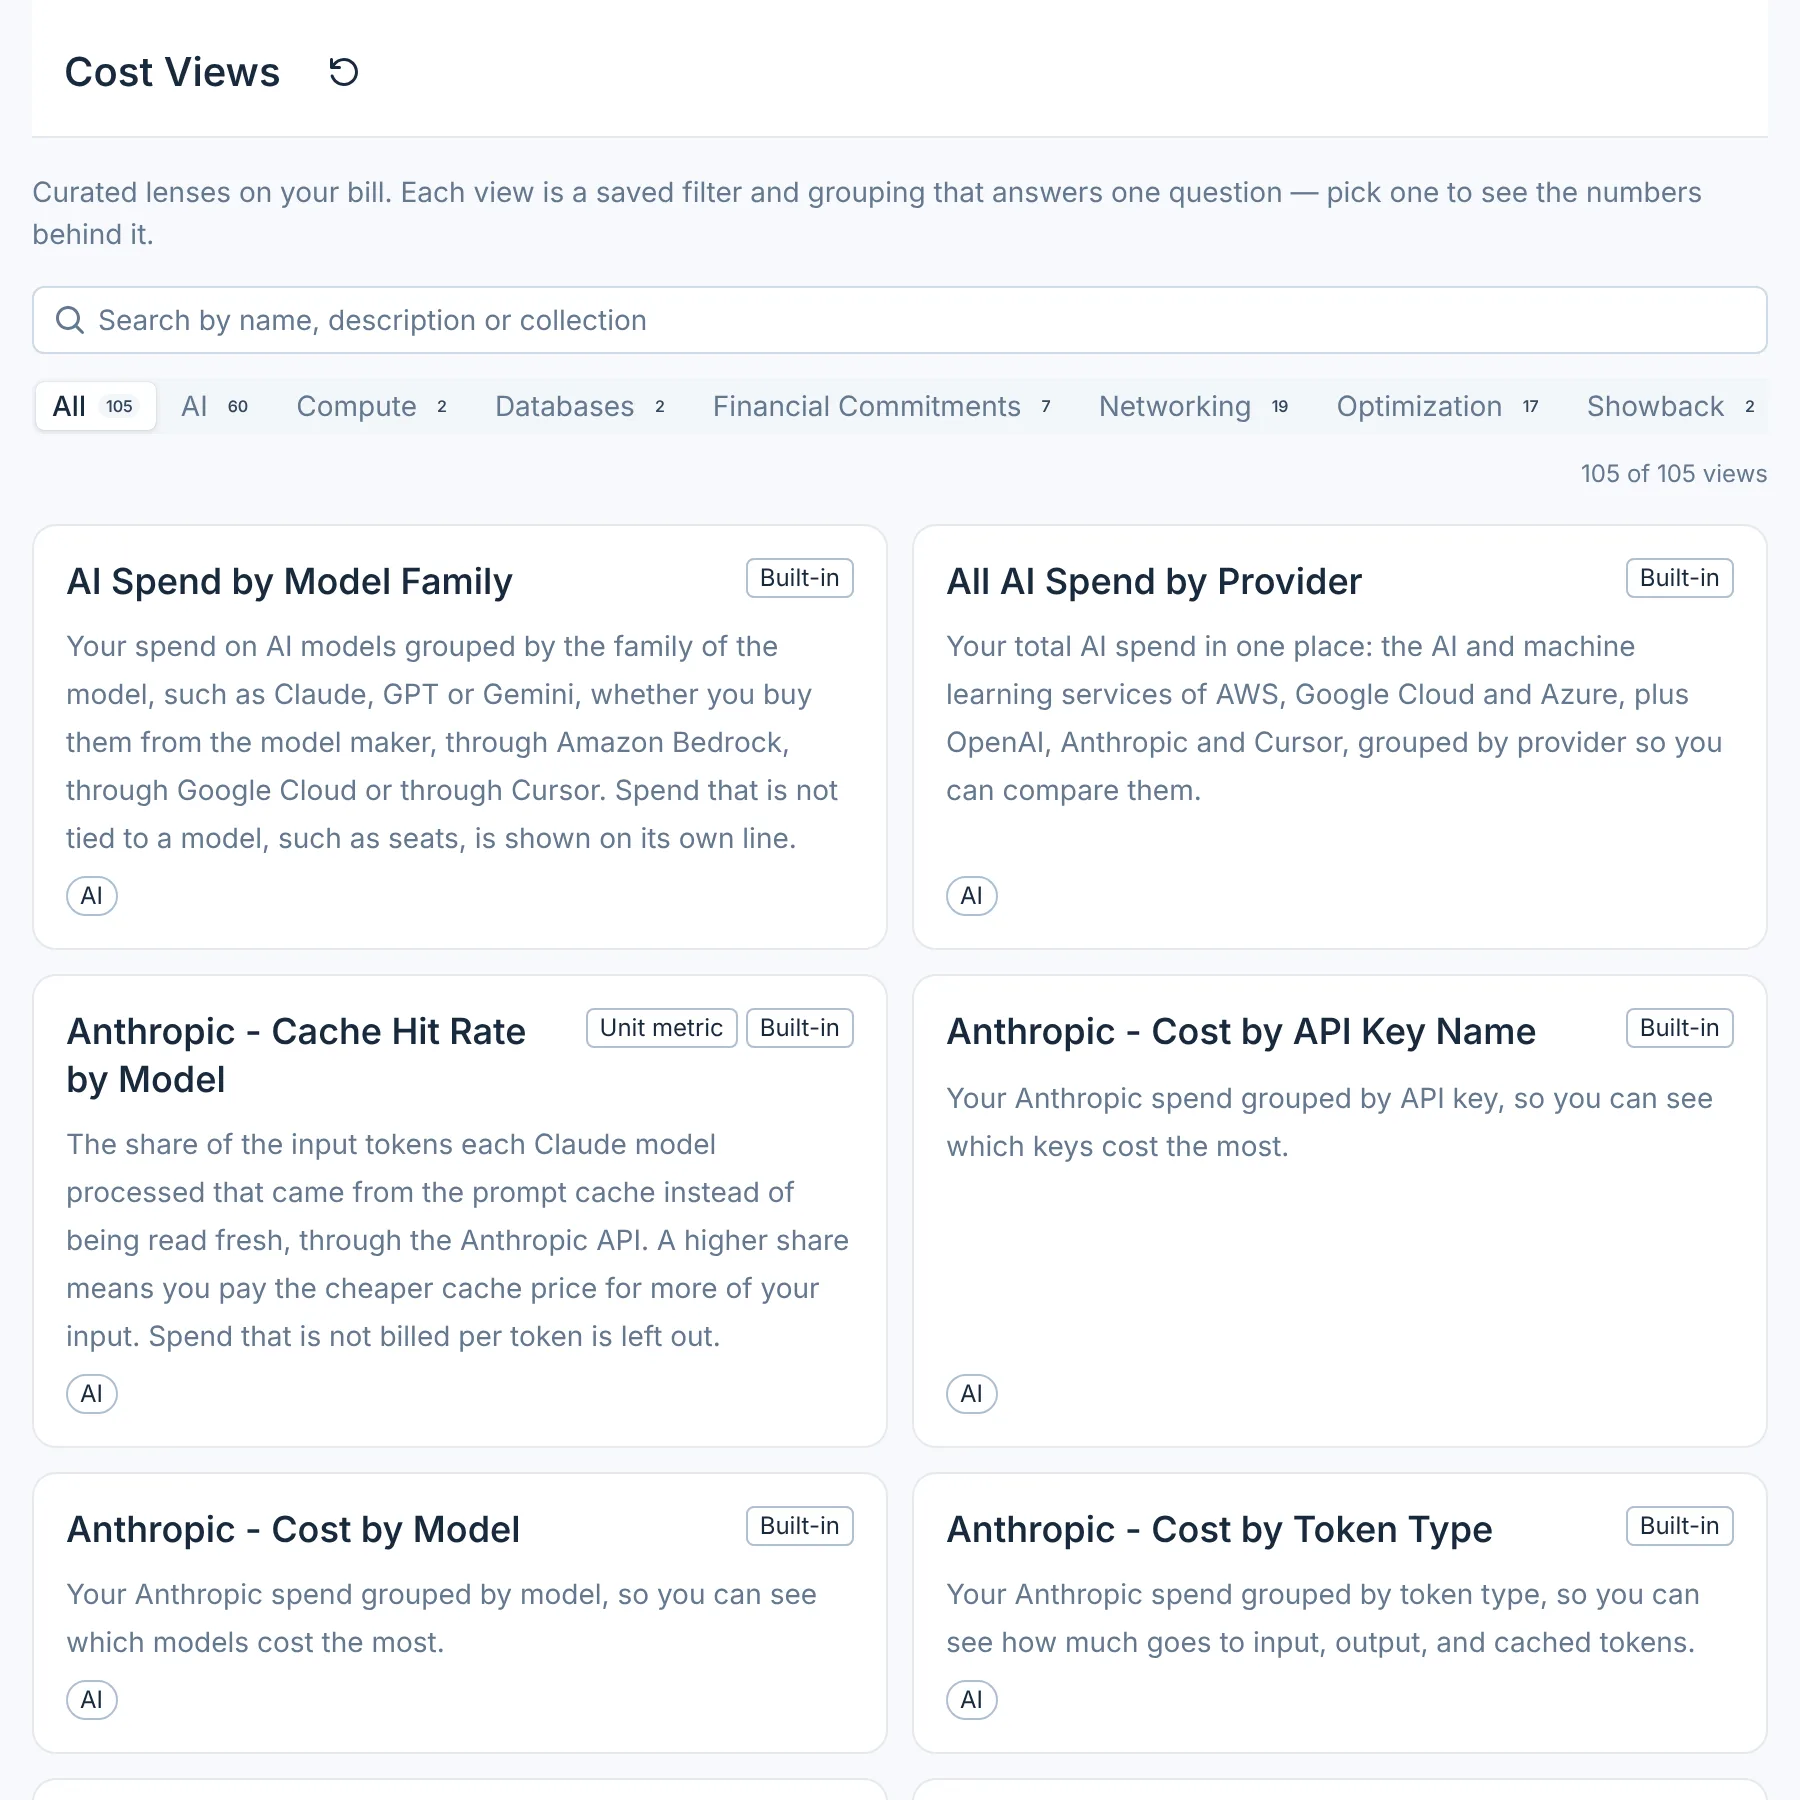
Cost Views are ready-made views of your bill. Each one answers a single cost question, such as "How much do I pay to move data between regions?", with a filter, a grouping and a chart already set. Open them under Cost Management → Cost Views.
What you can do
- Answer a common cost question without building a report: pick the view, read the chart.
- Change the period to the last 7, 30 or 90 days, and the granularity to daily, weekly or monthly.
- See each group's share of the total, and the resources behind a cost view's spend.
- Follow unit costs and ratios, such as AI cost per request or commitment coverage, over time.
Why it matters
Most cost questions are the same few, asked every month: what does data transfer cost, which EC2 instance types cost most, what are we paying for extended support. In Cost Explorer each one takes a filter, a grouping and a chart choice. A Cost View stores those choices once, so anyone on the team gets the same answer in one click.
How it works
CloudYali ships 105 built-in views in eight collections: AI, Networking, Optimization, Unit Economics, Financial Commitments, Compute, Databases and Showback. The catalogue lists every view and the question it answers.
| Kind | Shows | Count |
|---|---|---|
| Cost | Spend, grouped, with each group's share of the total and a Resources tab | 66 |
| Measure | A quantity other than spend, such as requests, tokens or unused commitment | 16 |
| Ratio | One figure divided by another, such as cost per request or coverage; always a line chart | 23 |
Views read the same billing data as Cost Explorer for AWS, Google Cloud, Microsoft Azure, Anthropic, OpenAI and Cursor; Databricks and Fastly are not in Cost Views. The Billing data through tile shows the latest day a view holds. For AWS, cost is unblended cost.
Views end yesterday, by UTC (Coordinated Universal Time), because providers are still adding today's charges. Dollar figures are rounded to the cent, and the groups add up to the view's total.
Read a view
- Open Cost Management → Cost Views and pick a collection.
- Select a view.
- Choose Last 7 days, Last 30 days or Last 90 days, and Daily, Weekly or Monthly.
- For a cost view, open Resources to see which resources make up the spend.
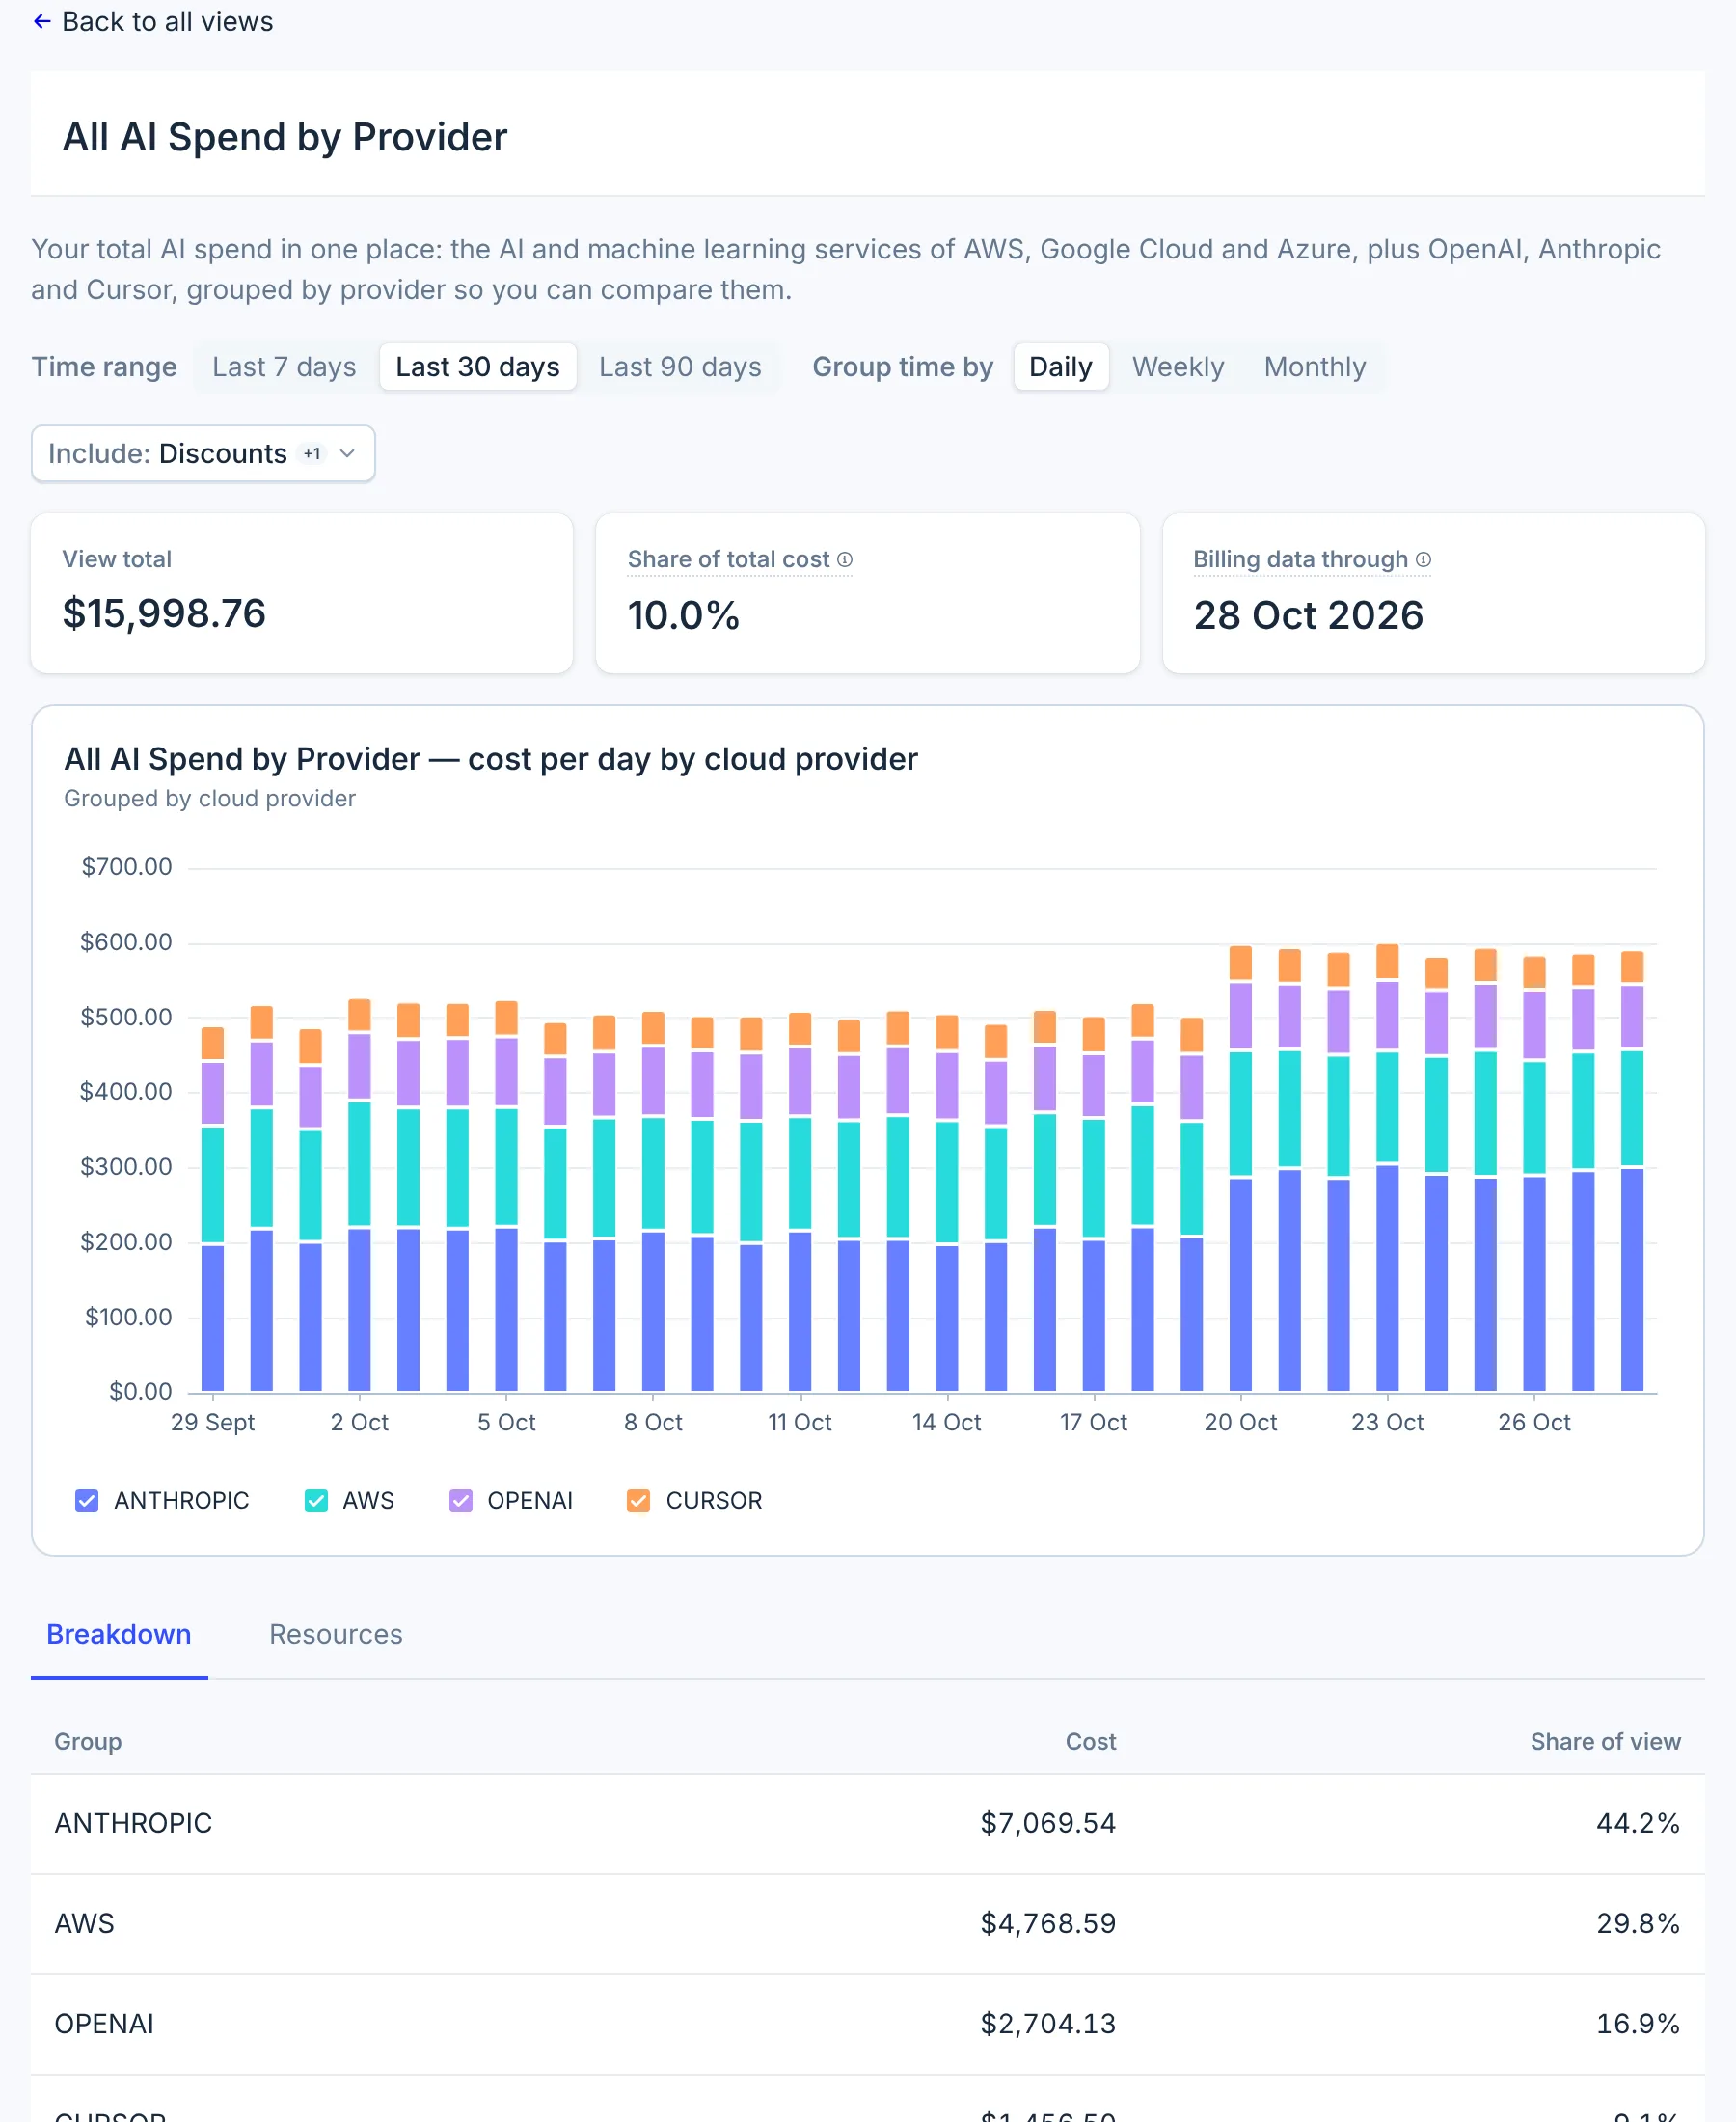
Include offers Credits, Discounts, Refunds and Taxes; discounts and taxes are on by default. Unlike Cost Explorer, every box takes effect here: with the defaults, Google Cloud credits and Azure refunds are left out, so those figures can read higher than in Cost Explorer. With no box ticked, none of the four counts.
Include does not appear on measure views, or on ratios whose numerator is not cost. See Cost types.
Supported providers
| Provider | Supported | Notes |
|---|---|---|
| AWS | Yes | |
| Microsoft Azure | Yes | |
| Google Cloud | Yes | Commitment views show coverage and savings; no utilization |
| Anthropic | Yes | In whole-bill and AI views; the workspace view shows IDs |
| OpenAI | Yes | In whole-bill and AI views |
| Cursor | Yes | Cost, usage and unit-cost views |
| Databricks | No | |
| Fastly | No |
Limits
- You cannot create, edit or save your own views yet. For a question no view answers, use Cost Explorer.
- A view has no custom date range and no filters: only the three periods and three granularities.
- There is no export.
- The Anthropic workspace view shows workspace IDs, not names.
FAQ
How is a Cost View different from Cost Explorer?
A Cost View has its filter, grouping and chart already set to answer one question. Cost Explorer lets you set them yourself.
Can I make my own view?
Not yet. Every view is built in. Use Cost Explorer for questions the views do not cover.
Why does a view not include today?
Providers keep adding charges for the current day, so views stop at yesterday, in UTC.
Where are the Reserved Instance and Savings Plan views?
In the Financial Commitments collection, which also has its own page: Commitments, under Financial Planning.