Cost Anomalies
Cost Anomalies is the CloudYali page that lists the days when a service cost well above its own baseline, with how much extra it cost and what drove it. Open it under Cost Management → Cost Anomalies.
What you can do
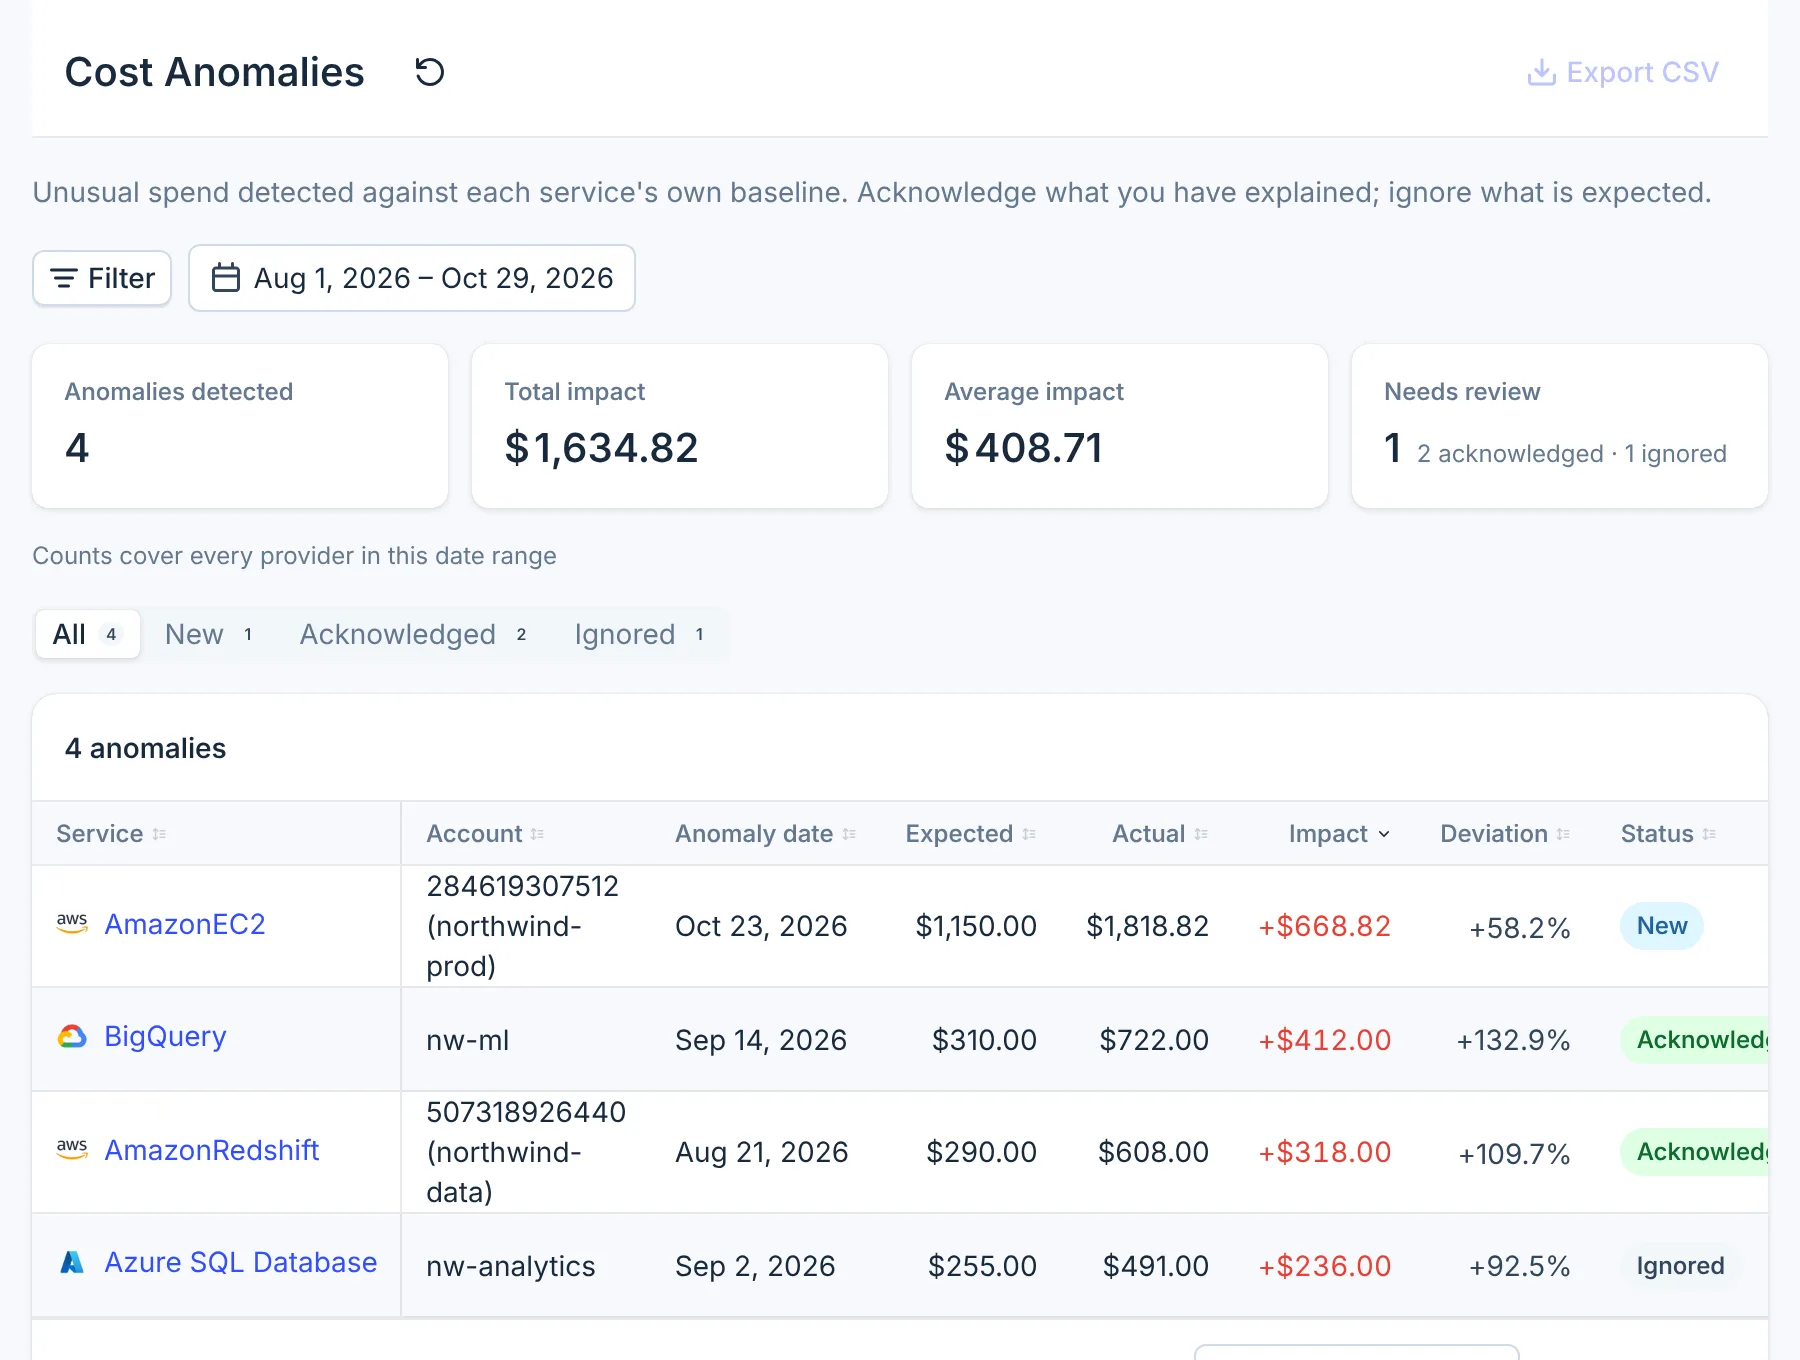
- See every anomaly in a date range, its expected and actual cost, and the impact: the spend above expected.
- Open an anomaly to read its root cause: the resources, usage types, regions and operations behind it.
- Mark an anomaly Acknowledged once you know the reason, or Ignore it if the spend was expected.
- Get an email and a Microsoft Teams card when a new anomaly is found.
Why it matters
A runaway job or a forgotten load test shows up on the bill weeks later, after the money is spent. CloudYali compares each service's daily cost with its own recent history, so a jump of a few hundred dollars on one service stands out even when your total bill barely moves.
How it works
Once a day, CloudYali looks at the cost of every service in every connected account, for the day two days before, so late billing data has arrived. Each service is compared with its own last 30 days:
| Check | Flags | When |
|---|---|---|
| Spike | A day far above the service's 30-day average, measured in standard deviations (see below). A cost that is normal for that weekday, or for that day of the month, is not flagged | The service had spend on 7 or more of the last 30 days |
| New service | A service with no spend in the previous 7 days that costs $100 or more in a day, or 15% of the account's average daily spend | AWS, Google Cloud and Azure only |
For a spike, the bar depends on the day's cost: a cheap service must jump further before it counts.
| The day's cost | Standard deviations above the 30-day average |
|---|---|
| Under $100 | 4.0 |
| $100 to $999 | 3.5 |
| $1,000 to $4,999 | 3.0 |
| $5,000 or more | 2.5 |
An anomaly is recorded only for an increase, and only when the impact is $100 or more. Credits and refunds are left out. When the same service jumps again within 7 days by about the same amount, it is treated as the same anomaly and not recorded twice.
| Term | Meaning |
|---|---|
| Expected | The service's average daily cost over the last 30 days, leaving out unusual days. $0 for a new service |
| Actual | Its cost on the anomaly date |
| Impact | Actual minus expected |
| Deviation | Impact as a share of expected |
Review an anomaly
- Open Cost Management → Cost Anomalies. It shows the last 90 days, the largest impact first.
- Select the service name to open the anomaly.
- Read Overview for the figures and the service's daily cost around the date.
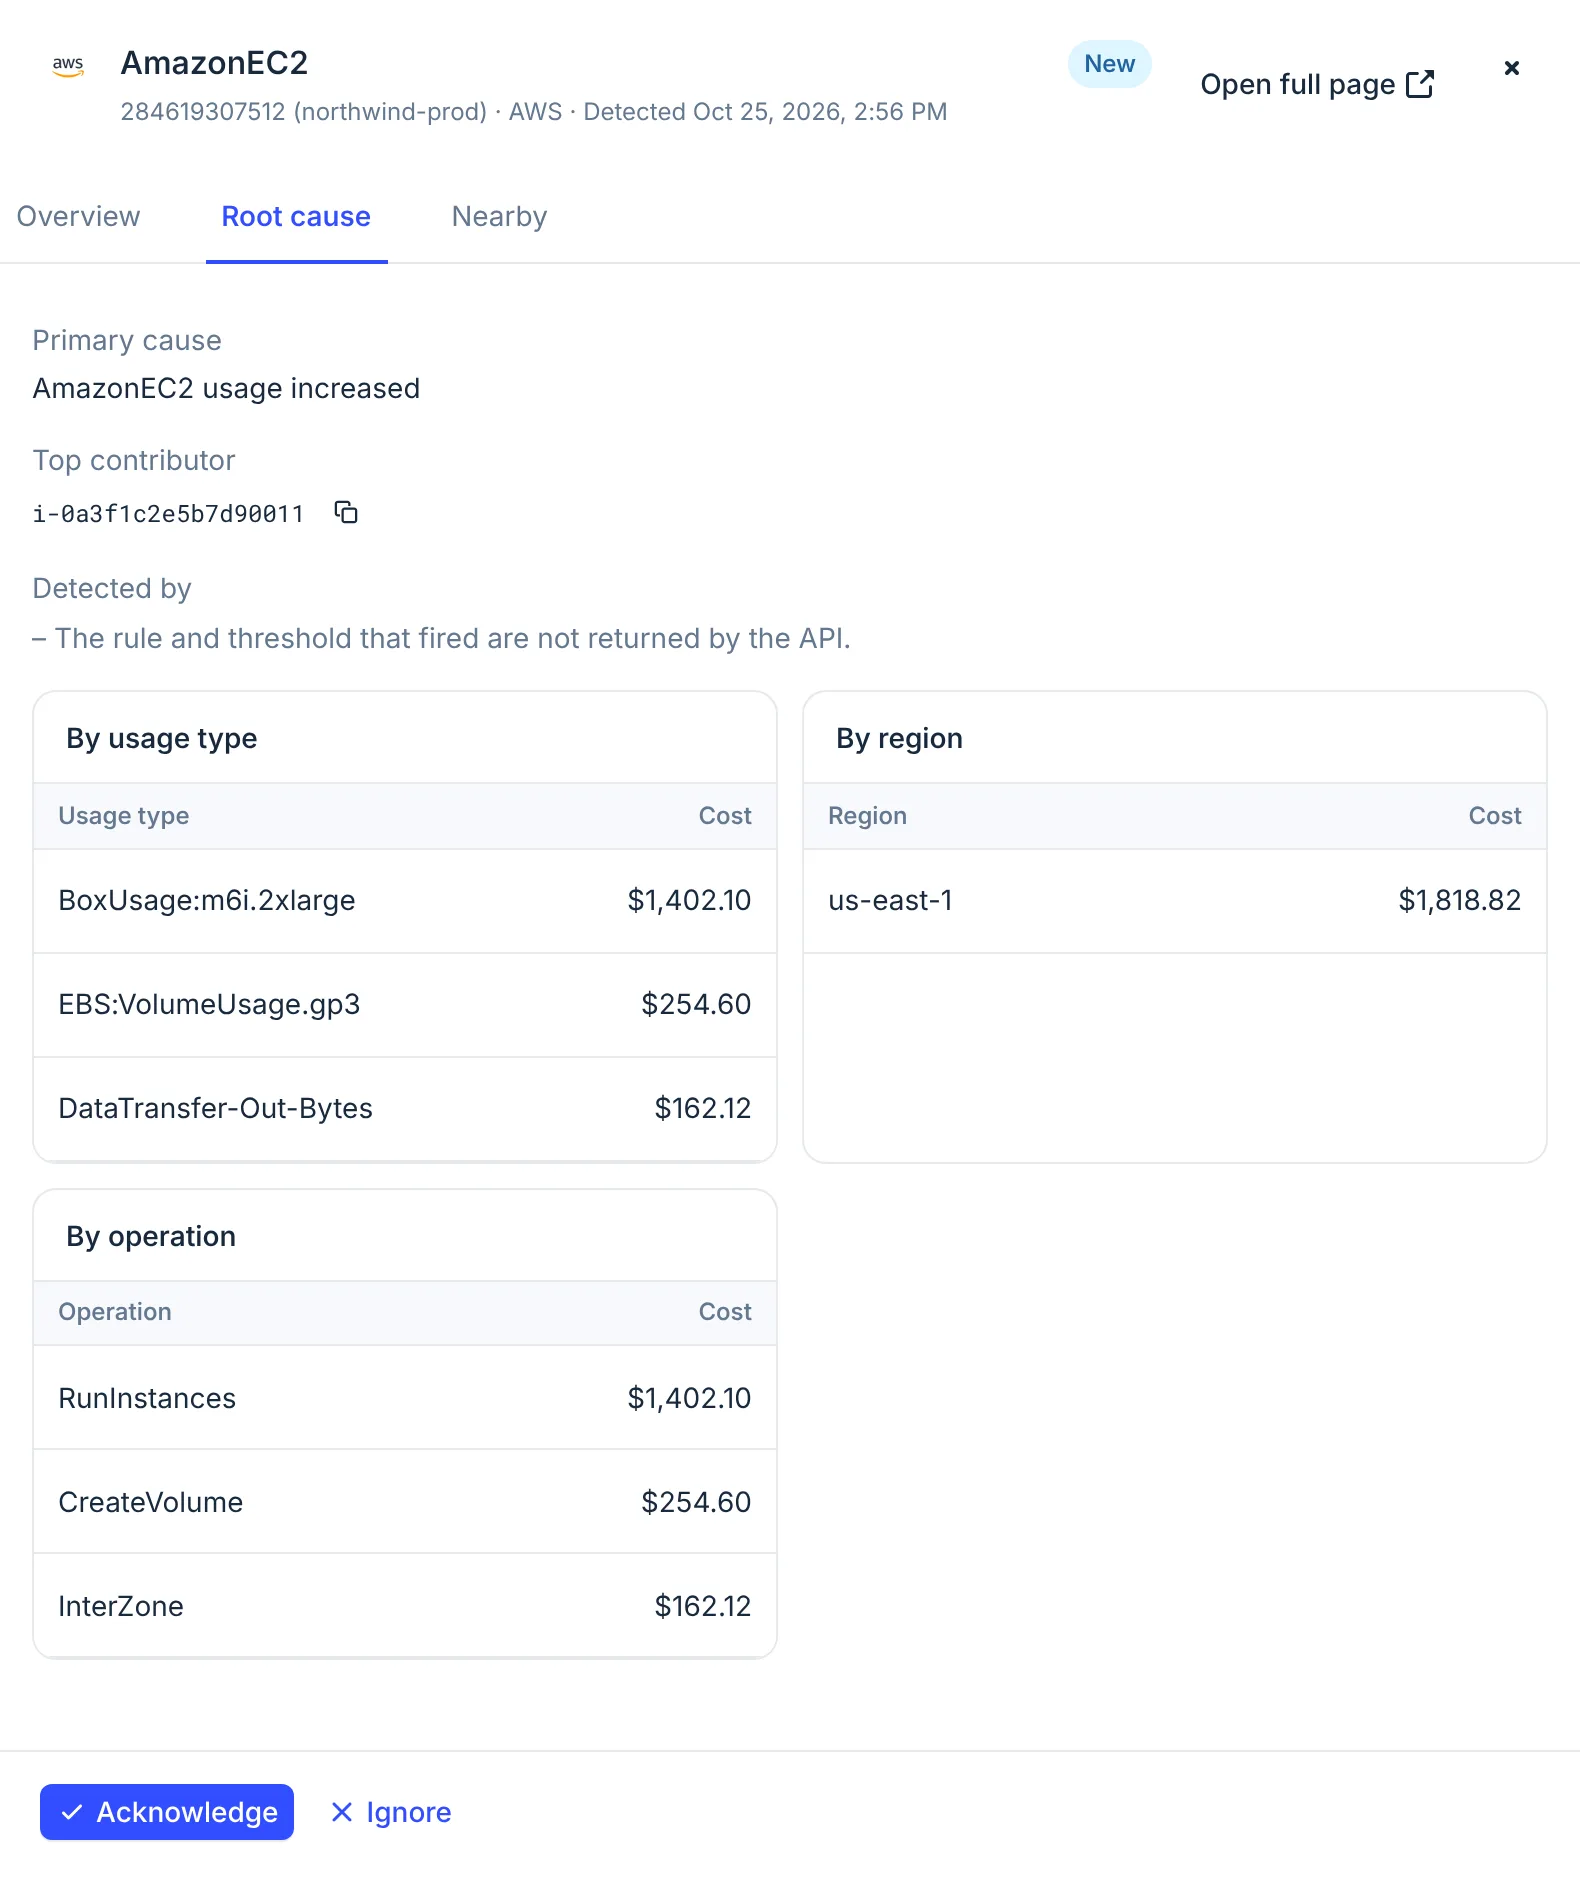
- Open Root cause for the primary cause, the top contributing resource, and that day's cost by usage type, region and, for AWS, operation.
- Select Acknowledge if you know why, or Ignore if the spend was expected.
Reopen sets an acknowledged or ignored anomaly back to New. Nearby lists other anomalies on the same service and account, within 30 days either side.
Filter the list
Select Filter to add a group for one provider, then narrow it by account and service. Within a group, an anomaly must match every rule. Across groups, it must match any one group.
The date range picks anomalies by their anomaly date. The tabs All, New, Acknowledged and Ignored filter by status. The tiles at the top, Anomalies detected, Total impact, Average impact and Needs review, count every provider in the date range, whatever the filters.
Alerts
As soon as CloudYali records a new anomaly, it sends an email to the email address your organization signed up with. Other users in your organization do not get it. If CloudYali support has connected a Microsoft Teams channel for you, a card goes to that channel too; to set one up, email support@cloudyali.io. Each anomaly is sent on its own, with its impact, expected and actual cost, and a link to the console.
Supported providers
| Provider | Supported | Notes |
|---|---|---|
| AWS | Yes | Spikes and new services; root cause by usage type, region and operation |
| Microsoft Azure | Yes | Spikes and new services, per subscription; root cause by meter subcategory and region |
| Google Cloud | Yes | Spikes and new services, per project; root cause by SKU and region |
| Anthropic | Yes | Spikes by model, per organization; no new-service check |
| OpenAI | Yes | Spikes by line item, per organization; no new-service check |
| Cursor | No | |
| Databricks | No | |
| Fastly | Yes | Spikes by product; no new-service check |
Limits
- Detection runs on data from two days ago, so the newest two days have no anomalies yet.
- Databricks and Cursor are not checked.
- The primary cause is often a general sentence, such as "AmazonEC2 usage increased". The breakdown shows the service's whole cost that day, not only the increase.
- You cannot add a note to an anomaly, and the console keeps no history of its status changes.
- Export CSV is not available yet.
- Alert recipients and thresholds cannot be changed in the console yet.
FAQ
Why did CloudYali not flag a rise I can see in Cost Explorer?
An anomaly needs an impact of $100 or more on one service on one day, and a rise steep enough against that service's own last 30 days. A slow climb, or a rise spread over many services, is not flagged.
Why is the newest anomaly from two days ago?
CloudYali checks the day two days back, so providers have finished adding that day's charges.
Does Ignore stop alerts for that service?
No. Ignore only records that this anomaly was expected. A later rise on the same service is still detected and sent.
Do ignored anomalies count in the totals?
Yes. Anomalies detected, Total impact and Average impact count every status.