Cost Explorer
Cost Explorer charts your spend across every connected cloud and AI provider for the period you pick, grouped by account, service, region or cost type. Open any group to see the resources behind it and each resource's cost per day.
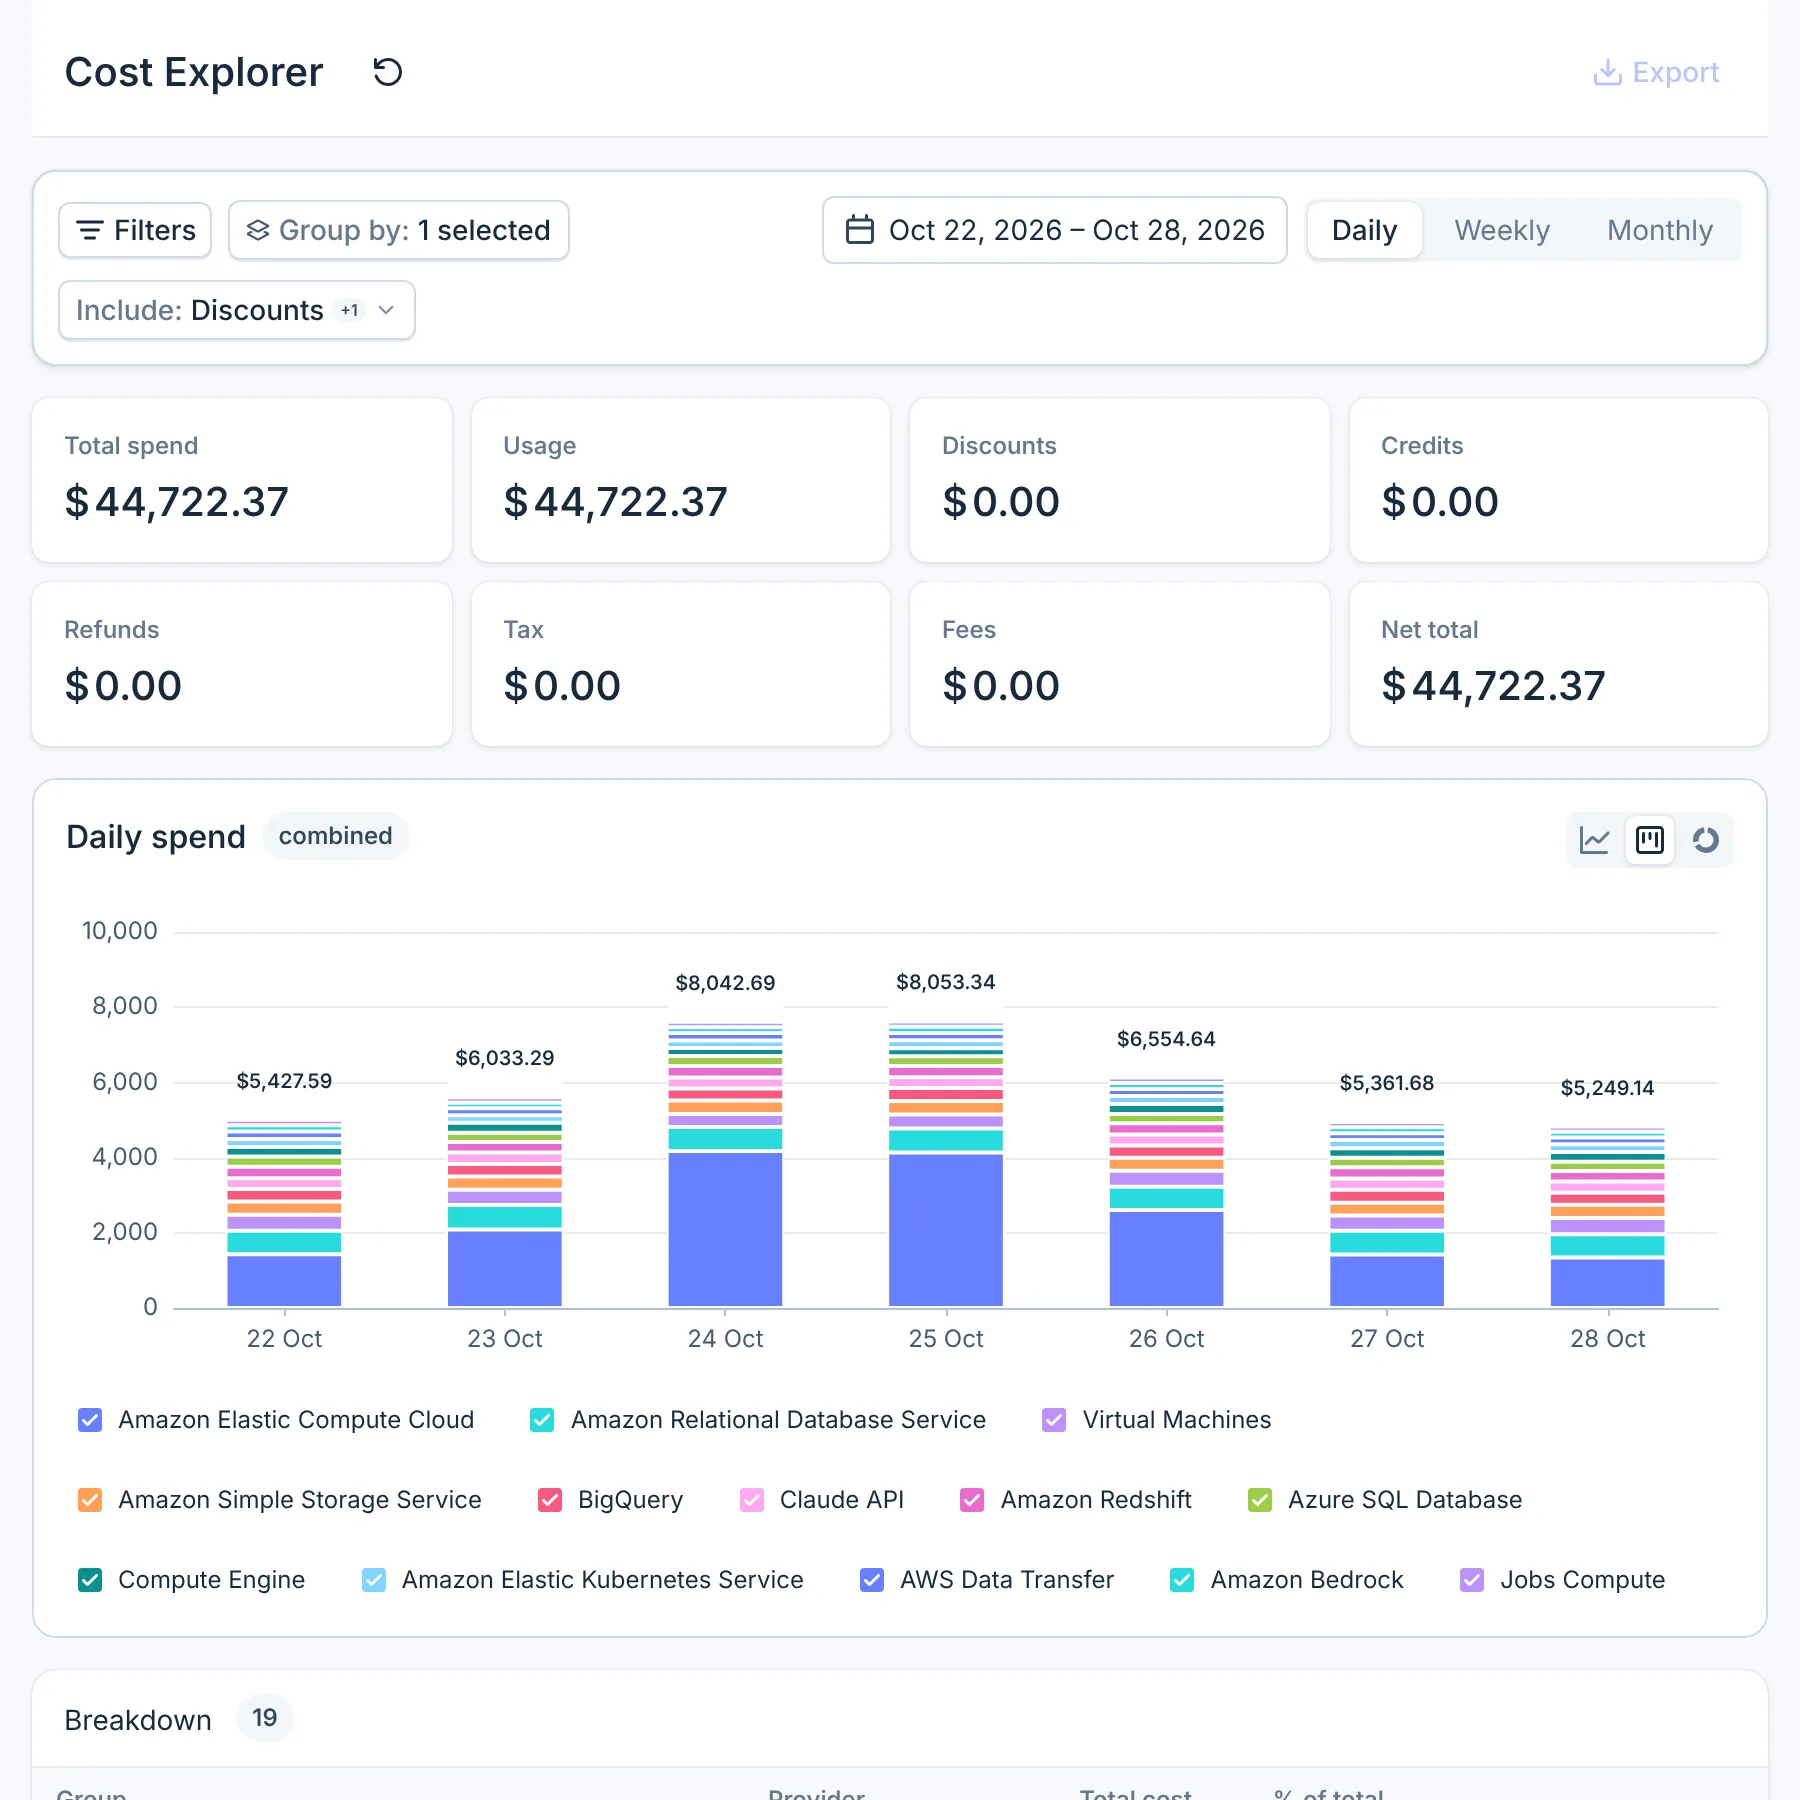
- Filters
- Group by
- Period
- Granularity
- Include
What you can do
- See total spend for any period, split into usage, discounts, credits, refunds, tax and fees.
- Group spend by up to four of: account, region, service, cloud provider, usage type and cost type.
- Filter by cloud provider, account, region, service and tag.
- Open any group to see its resources and what each one cost per day, week or month.
- Open a resource CloudYali has scanned to see its account, region, tags, configuration and daily cost.
- Share a view: the page address holds the period, grouping, granularity, filters and included costs.
Why it matters
A monthly bill gives you a total. When the total moves, Cost Explorer shows which service moved, in which account, and which resources caused it, for every provider on one page.
For example, Northwind Labs (a fictional company) spent $44,722 in the week of 22–28 October 2026, with
two days near $8,000 against a usual $5,400. Grouped by service, Amazon EC2 was 38% of the week. Its
breakdown listed three ingest-loadtest instances first, each at $0.00 on 22 October and about
$1,000 a day over the weekend. The cause was a load test left running from Friday evening to Monday.
How it works
- Data. Cost Explorer reads the billing data CloudYali collects from each connected provider. Totals and the breakdown come from the same request, so they always describe the same scope.
- Period. The page opens on the last 30 days, including today. Future dates cannot be picked.
- Granularity. Daily, Weekly or Monthly sets the chart's bars and the resource columns.
- Chart type. The chart switches between a line chart, stacked bars and a pie chart. With a Group by, the pie shows each group's share of the period.
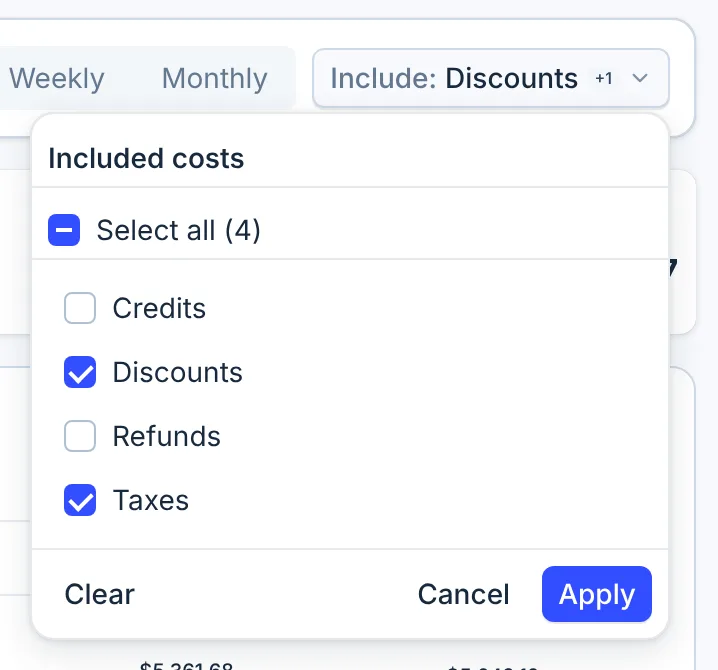
- Adjustments. Include decides which adjustments count in the figures: Discounts and Taxes are ticked by default; Credits and Refunds are not. AWS discounts, Google Cloud credits and Microsoft Azure refunds always count, whatever the boxes say. See Cost types.
- Resources. A resource's row shows its billed cost. Resources whose net cost is zero or less, for example ones fully covered by credits, are left out of the resource list but still counted in the totals.
Find what drove a cost increase
-
Open Cost Management → Cost Explorer and set the period to the days around the increase.
-
Open Group by, tick Service and select Apply. The chart stacks spend by service.
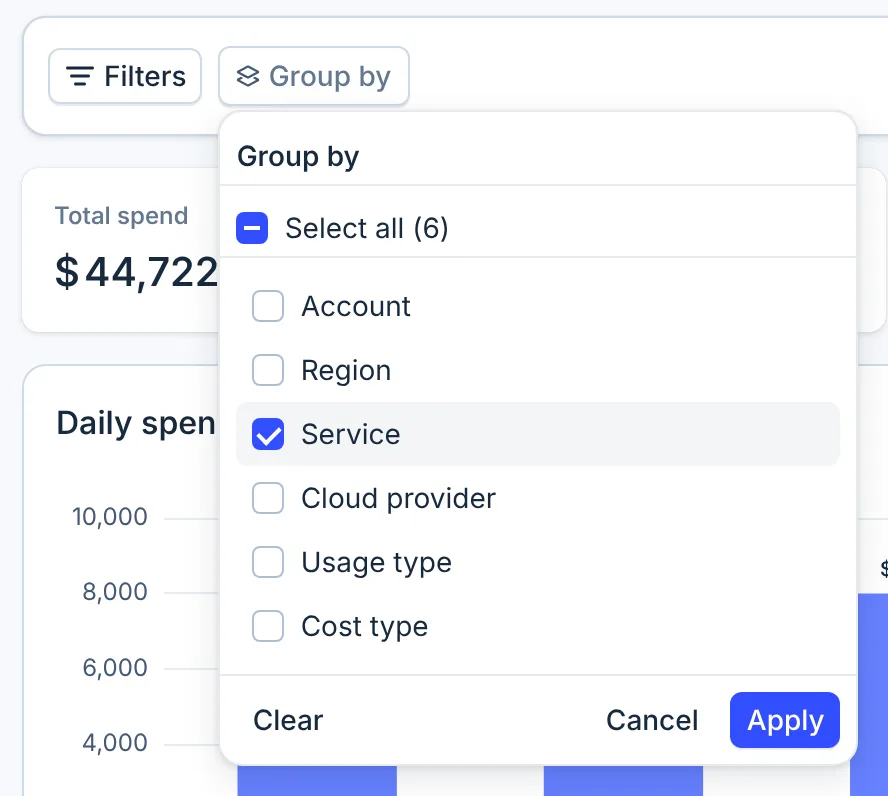
- Service
-
In Breakdown, the largest group is first and already open. Its resources are listed with their cost for each day of the period, largest first.
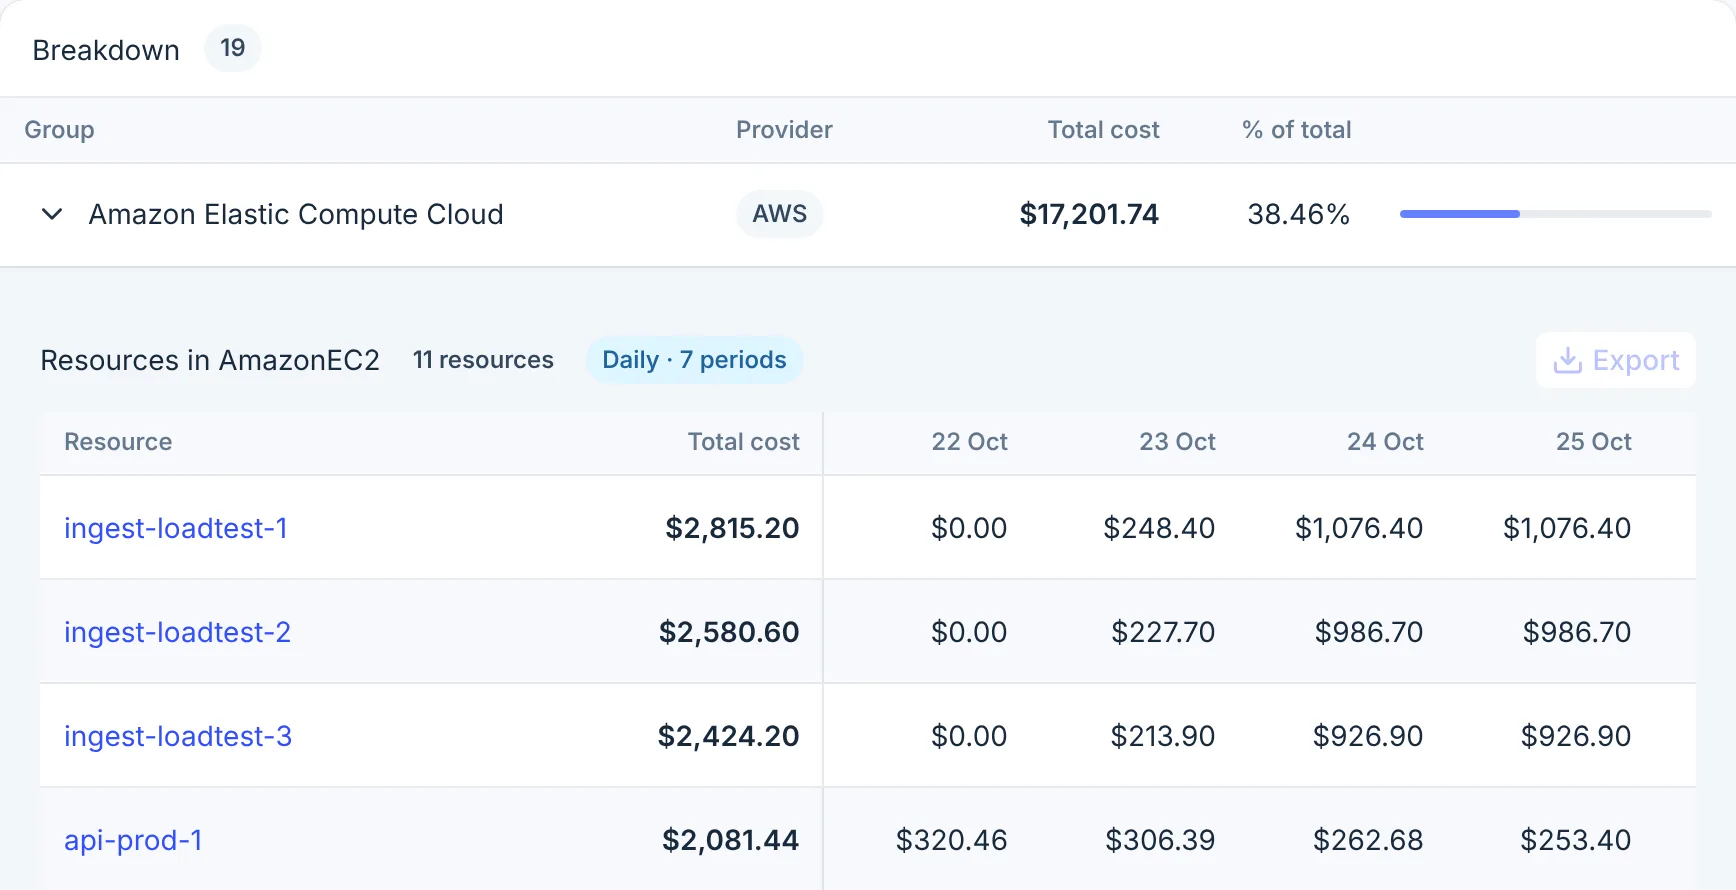
- Group row
- Resource
-
Select a resource name to open it. For a resource CloudYali has scanned, the Costs tab shows what it cost each day it was billed. Days with no billing record are left out of the chart.
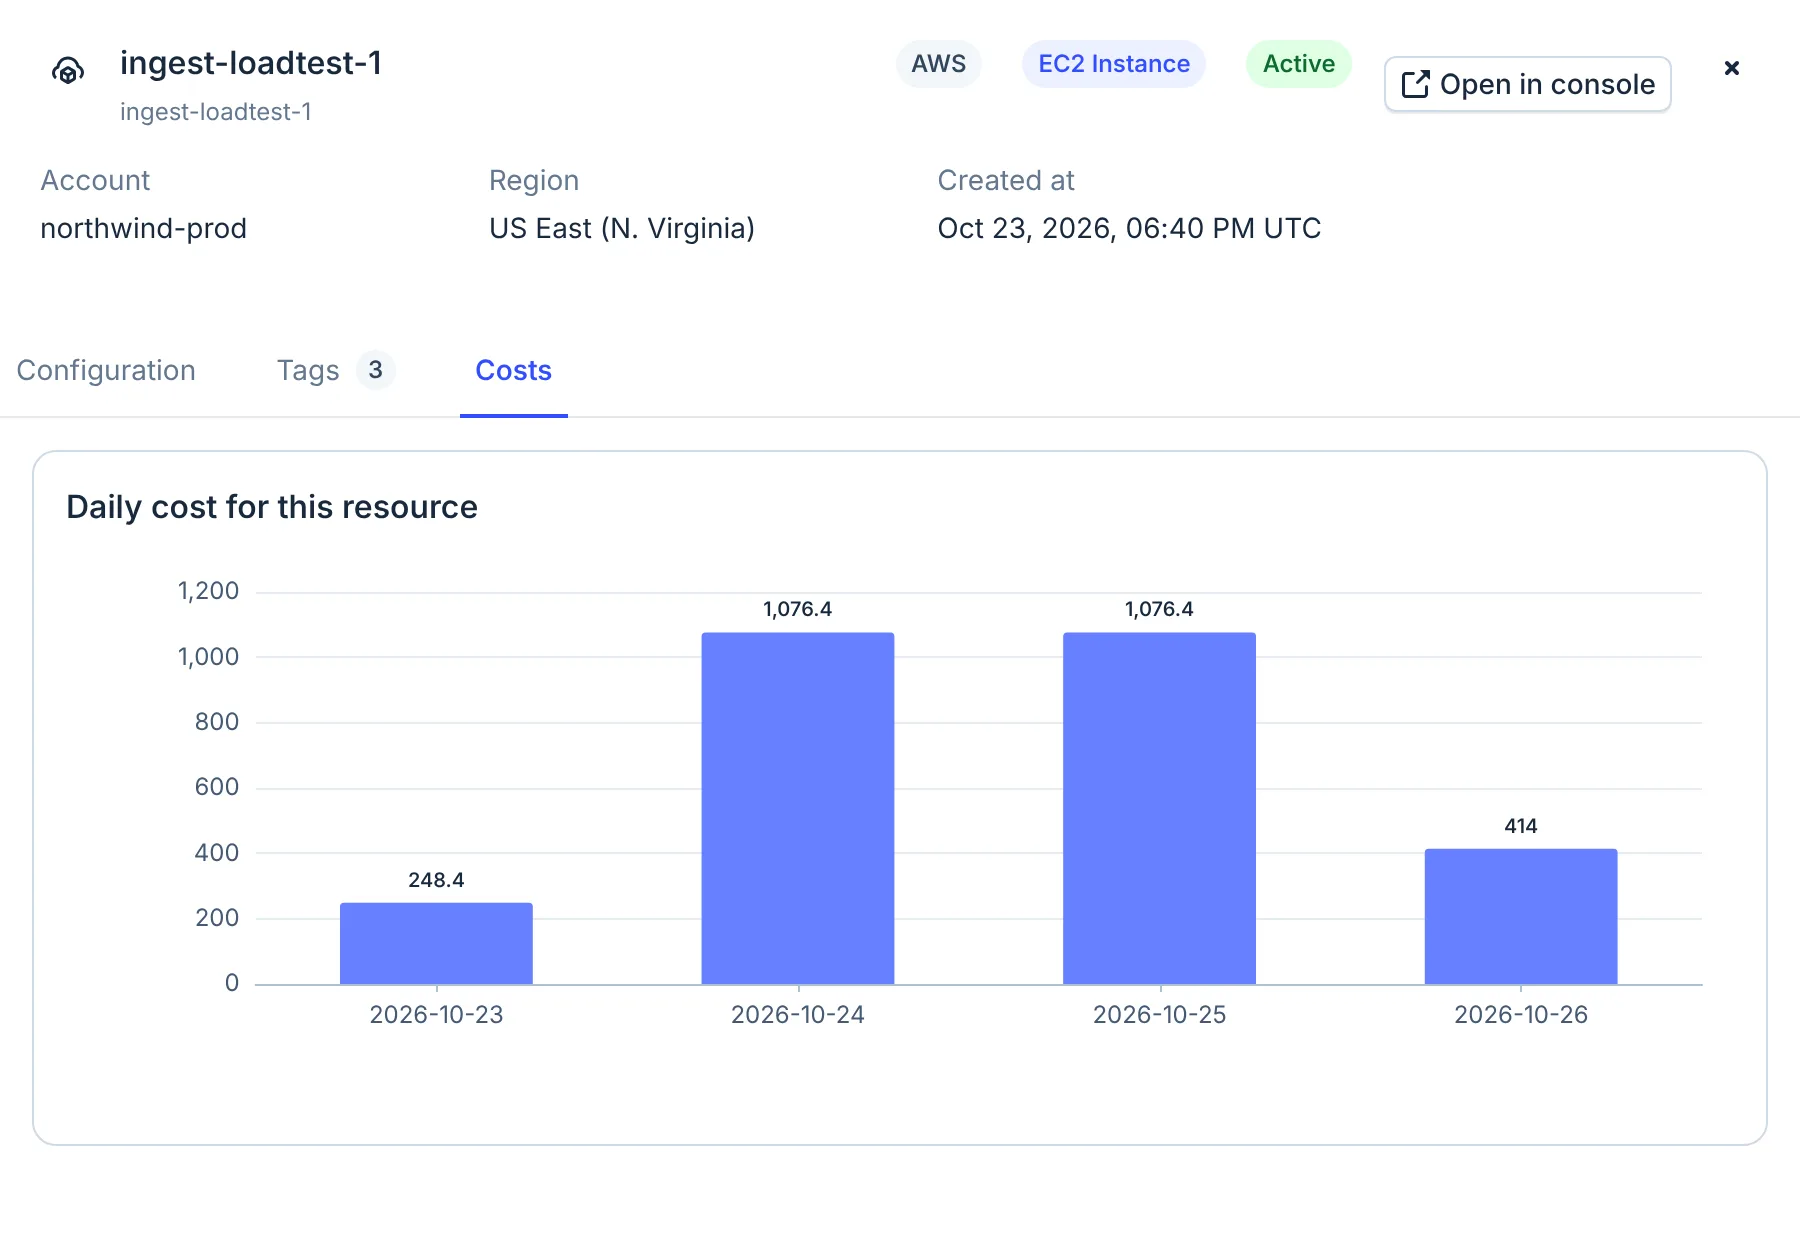
- Costs tab
Narrow the view with filters
-
Select Filters, then Add filter group.
-
Choose a Cloud provider. Each filter group holds one provider.
-
Select Add rule to narrow it by Account, Region, Service or Tag, with is any of or is none of.
-
To include another provider, select Add filter group again. Groups are combined, so two groups show both providers.
-
Select Apply.
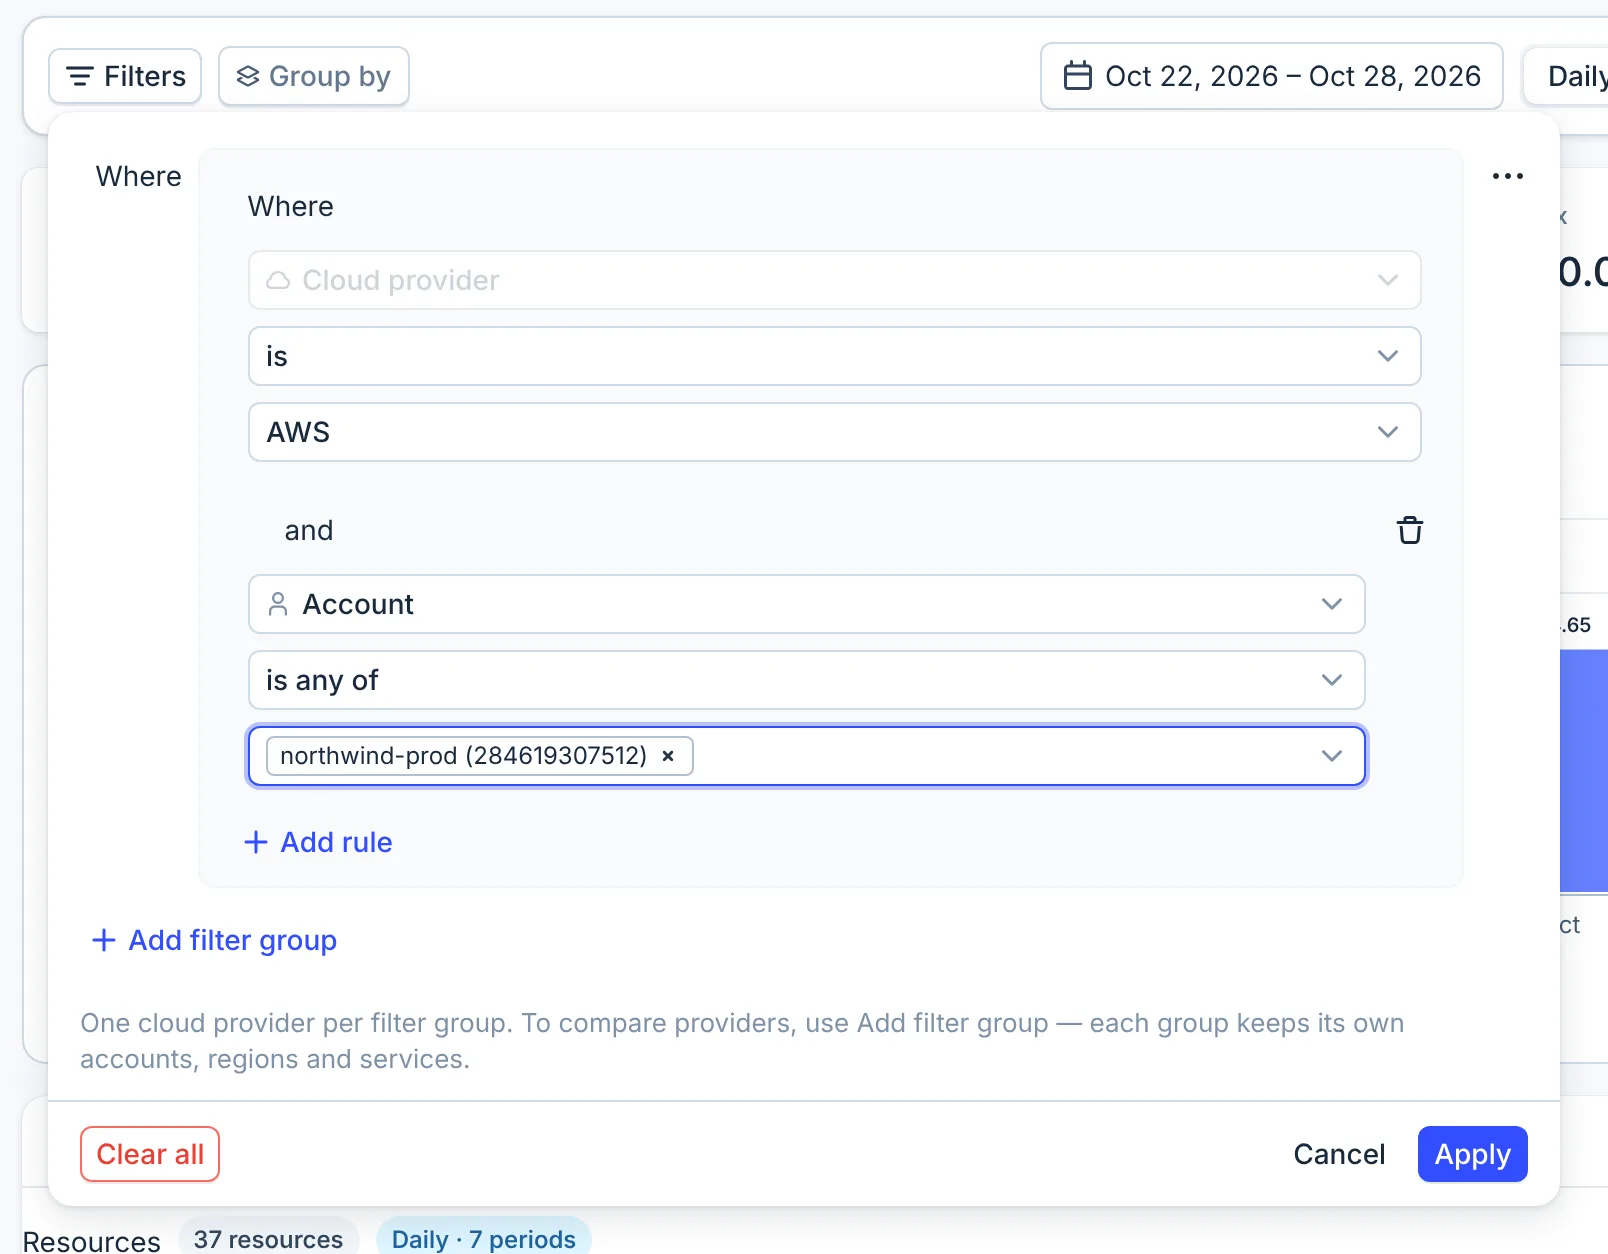
- Add filter group
- Cloud provider
- Add rule
Choose which costs count
Open Include and tick the adjustments to count: Credits, Discounts, Refunds and Taxes. The tiles above the chart show each kind of cost separately; a kind you leave out reads $0.00.
Some reductions always count, because they offset a charge that is always counted: AWS discounts, Google Cloud credits and Azure refunds. So Discounts changes nothing, Credits affects only AWS, and Refunds affects only AWS. Cost types has the full table.
Supported providers
| Provider | Supported | Notes |
|---|---|---|
| AWS | Yes | Amazon Bedrock spend shows as its own service |
| Microsoft Azure | Yes | |
| Google Cloud | Yes | |
| Anthropic | Yes | |
| OpenAI | Yes | |
| Cursor | Yes | |
| Databricks | Yes | |
| Fastly | Yes |
Limits
- Export is not available yet.
- About seven months of history. AWS, Google Cloud, Azure, Databricks and Fastly cost goes back to the 1st of the month seven months ago. Older ranges, such as Last year, show $0.00 for them.
- No box ticked is not usage only. With every Include box cleared, CloudYali falls back to its default, which counts AWS credits and AWS and Azure tax. Leave Discounts ticked instead.
- Unknown line types are left out. Cost Explorer counts only the line types it knows, such as
AWS
UsageorFee. Others, such as an AWS Enterprise Discount Program discount, are not counted; see Cost types. - Cash basis only. There is no amortized view; a commitment's fee shows on the day it is billed.
- Group by takes at most four dimensions at a time.
- A resource opens with its details only when its billing name matches a resource CloudYali has scanned. EC2 instances, EBS volumes and Azure resources match; database names, load balancer paths and Google Cloud resource names often do not. Those open with a notice instead of configuration, tags and daily cost. Their cost is still in the Breakdown row, and Open in Resource Inventory searches for them there.
FAQ
Why does Cost Explorer show a different total from AWS Cost Explorer?
The usual reasons are which adjustments are included, billing data that arrives a day or two late, and amortized versus unblended cost. In CloudYali, check Include: Discounts and Taxes are ticked by default, and AWS credits and refunds count only when ticked. See Why CloudYali totals differ from your provider's console.
Can I compare two cloud providers in one chart?
Yes. With no filters, every connected provider is included. To limit it to some providers, add one filter group per provider; groups are combined.
Can I send someone the exact view I am looking at?
Yes. Copy the page address. It holds the period, Group by, granularity, filters and included costs, so the link opens the same view.
Why is a resource missing from the list when the group has spend?
Resources whose net cost is zero or less, for example ones fully covered by credits or refunds, are left out of the resource list. Their cost is still counted in the totals.
Related
- Resource Inventory: every resource, with its tags and configuration
- Resource cost: a resource's cost from its Inventory page
- Cost Views: ready-made views for common cost questions