Financial Commitments
Financial Commitments is a CloudYali feature that tracks commitment discounts across AWS, Microsoft Azure and Google Cloud: AWS Reserved Instances and Savings Plans, Azure reservations and savings plans, and Google Cloud committed use discounts (CUDs). It reports five metrics (coverage, utilization, unused commitment, net savings and effective savings rate) in seven built-in views. Open it in the CloudYali console under Financial Planning → Commitments. No setup is needed once your billing data is connected.
Summary
| Item | Details |
|---|---|
| Where to find it | Financial Planning → Commitments in the CloudYali console. The same views are in Cost Views, in the Financial Commitments collection. |
| Clouds | AWS, Azure, Google Cloud |
| Commitment types | AWS Reserved Instances and Savings Plans, Azure reservations and savings plans, Google Cloud resource-based and spend-based CUDs |
| Metrics | Coverage, utilization, unused commitment, net savings, effective savings rate (ESR) |
| Views | 7 built-in, read-only views |
| Data source | The billing data you already connect: AWS Cost & Usage Report, Azure Cost Management export, Google Cloud BigQuery billing export |
| Refresh | Once a day, after billing data arrives |
| Setup | None |
What is a commitment discount?
A commitment discount is a lower price you get for agreeing to use a fixed amount of cloud capacity, or to spend a fixed amount per hour, for one or three years. You pay for the commitment whether you use it or not. Usage the commitment does not cover is billed at the on-demand price.
| Provider | Commitment | Maximum published discount vs on-demand |
|---|---|---|
| AWS | EC2 Instance Savings Plans | Up to 72% (AWS) |
| AWS | Compute Savings Plans | Up to 66% (AWS) |
| AWS | Database Savings Plans | Up to 35% (AWS) |
| Azure | Reserved VM Instances | 36% to 72% (Microsoft) |
| Google Cloud | Resource-based CUDs, 3-year | Up to 55%, or 70% for memory-optimized machines (Google Cloud) |
The discount you get depends on the term, the payment option and the resources. Your actual savings also depend on how much of the commitment you use. Utilization and the effective savings rate measure this.
Which commitments does CloudYali track?
| Cloud | Commitment | Shown in CloudYali as | Covers |
|---|---|---|---|
| AWS | Reserved Instances | Reserved Instance | EC2, RDS, ElastiCache, OpenSearch, Redshift, MemoryDB, DocumentDB, Neptune, DynamoDB reserved capacity |
| AWS | Compute Savings Plans | Savings Plan (Compute) | EC2 instances, Fargate (ECS and EKS), Lambda |
| AWS | EC2 Instance Savings Plans | Savings Plan (EC2 Instance) | EC2 instances in one instance family and region |
| AWS | SageMaker Savings Plans | Savings Plan (SageMaker) | SageMaker ML instances |
| AWS | Database Savings Plans | Savings Plan (Database) | RDS and Aurora, DynamoDB, ElastiCache, DocumentDB, Neptune and other database services |
| Azure | Reservations | Reservation | Virtual machines, App Service, SQL Database, Cosmos DB, MySQL, PostgreSQL, Redis, Synapse, Databricks and more |
| Azure | Savings plan for compute | Azure Savings Plan | Virtual machines, App Service, Functions Premium plan, Container Instances, Container Apps |
| Google Cloud | Resource-based CUDs | Committed Use Discount (Resource) | Compute Engine vCPU, memory, GPUs and local SSD |
| Google Cloud | Spend-based (flexible) CUDs | Committed Use Discount (Spend) | Compute Engine, GKE, Cloud Run, Cloud SQL, Memorystore, Spanner, AlloyDB, BigQuery and more |
The Shown in CloudYali as column is the commitment type used in charts and tables.
Eligible usage is on-demand usage that a commitment could cover. Spot and preemptible usage is not eligible. If one of your commitments covered a type of usage, the same usage running on-demand is also counted as eligible. This keeps eligibility current when a provider adds services to a commitment type.
What do the metrics mean?
All dollar amounts are valued at the public on-demand price (the list price on Azure). Negotiated discounts, such as an AWS Enterprise Discount Program or an Azure EA or MCA discount, are not included. This keeps covered and uncovered usage on the same scale.
| Metric | Definition | Formula | Higher is |
|---|---|---|---|
| Coverage | The share of eligible usage that a commitment covered | covered usage ÷ eligible usage | Better, if utilization stays high |
| Utilization | The share of the commitment you paid for that usage consumed | used commitment ÷ total commitment | Better |
| Unused commitment | Commitment you paid for but did not use, in dollars | total commitment − used commitment | Worse |
| Net savings | What commitments saved compared with on-demand prices, after paying for them | on-demand value of covered usage − commitment cost | Better |
| Effective savings rate (ESR) | Net savings as a share of what all eligible usage would cost on-demand | net savings ÷ eligible usage | Better |
Example calculation
| Input | Value |
|---|---|
| Eligible usage at on-demand prices | $1,000 |
| Usage covered by commitments, at on-demand prices | $800 |
| Commitment cost | $560 |
| Commitment used | $520 |
| Metric | Calculation | Result |
|---|---|---|
| Coverage | $800 ÷ $1,000 | 80% |
| Utilization | $520 ÷ $560 | 93% |
| Unused commitment | $560 − $520 | $40 |
| Net savings | $800 − $560 | $240 |
| Effective savings rate | $240 ÷ $1,000 | 24% |
How do I read a commitment view?
This walkthrough opens each view on the example data, from coverage to effective savings rate.
Each view has the same parts:
- Summary tiles. Ratio views show the rate and the two totals used to calculate it, for example Coverage, Covered usage (on-demand value) and Eligible usage (on-demand value). Dollar views show the total, for example Total unused commitment.
- Billing data through. The latest billing day in the view. Providers finalize billing one to two days late, so recent days can still change. AWS keeps updating a day's billing until the day ends, so an AWS day appears once the next day's billing data arrives.
- Chart. The metric over time, one line or bar series per group.
- Breakdown table. Totals per group for the selected range.
- Time range. Last 7, 30 or 90 days.
- Group time by. Daily, weekly or monthly.
Rules that apply to every view:
- The rate tile is not an average of the chart. It is calculated from the totals for the whole range, so periods with more usage count for more.
- Faded first or last bars are partial periods. The range starts or ends partway through that week or month.
- A dash or a gap means unknown, not zero. CloudYali shows a dash (—) in tiles and tables, and a gap in the chart, when billing data does not contain enough information to calculate a value. A dollar total that includes an unknown day shows a dash too, rather than a smaller total that leaves the day out. A ratio with nothing to divide by also shows no value.
- No Include control, Share of Total Cost or Resources tab. Commitment views measure commitments, not a slice of your bill, so these cost-view controls do not apply.
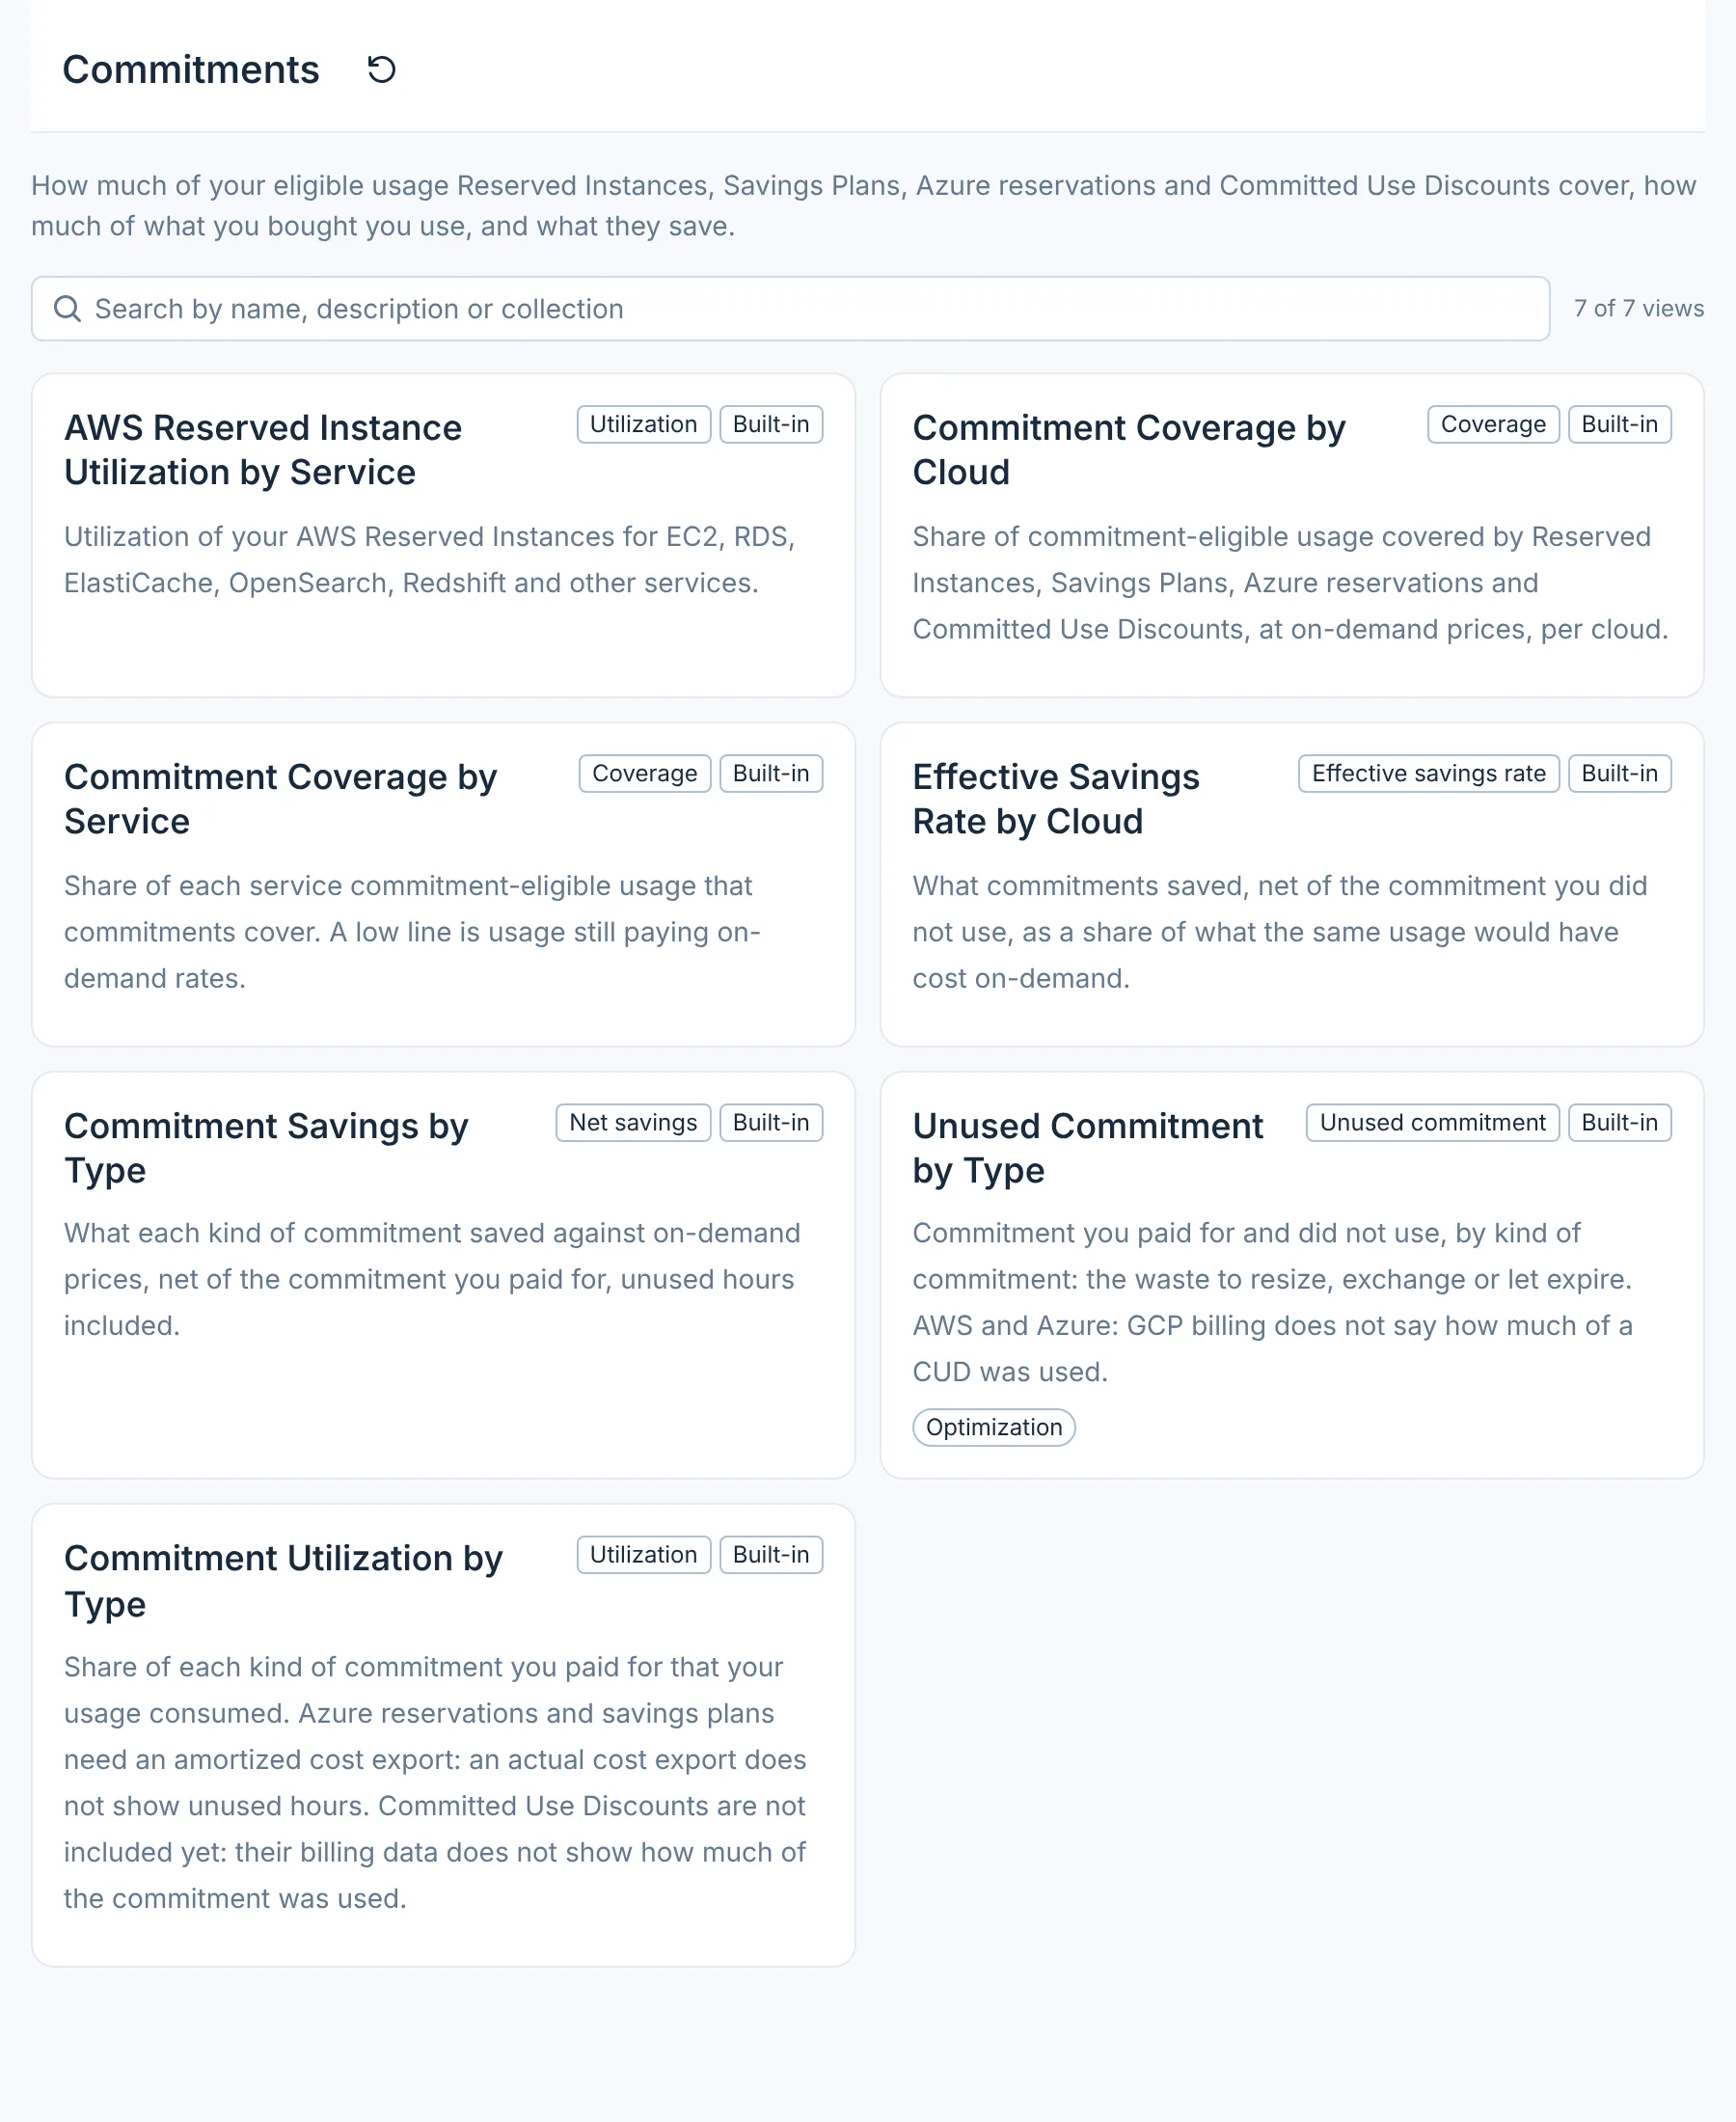
Which views are included?
| View | Metric | Grouped by | Use it to |
|---|---|---|---|
| Commitment Coverage by Cloud | Coverage | Cloud | Compare coverage across AWS, Azure and Google Cloud |
| Commitment Coverage by Service | Coverage | Service | Find services that still pay on-demand prices |
| Commitment Utilization by Type | Utilization | Commitment type | Find commitment types that are not fully used |
| AWS Reserved Instance Utilization by Service | Utilization | Service | Find under-used AWS Reserved Instances by service |
| Unused Commitment by Type | Unused commitment | Commitment type | See the dollar cost of unused commitment |
| Commitment Savings by Type | Net savings | Commitment type | Report what each commitment type saved |
| Effective Savings Rate by Cloud | ESR | Cloud | Track overall savings per cloud over time |
The examples below use sample data.
Commitment Coverage by Cloud
Shows the share of eligible usage covered by any commitment, per cloud.
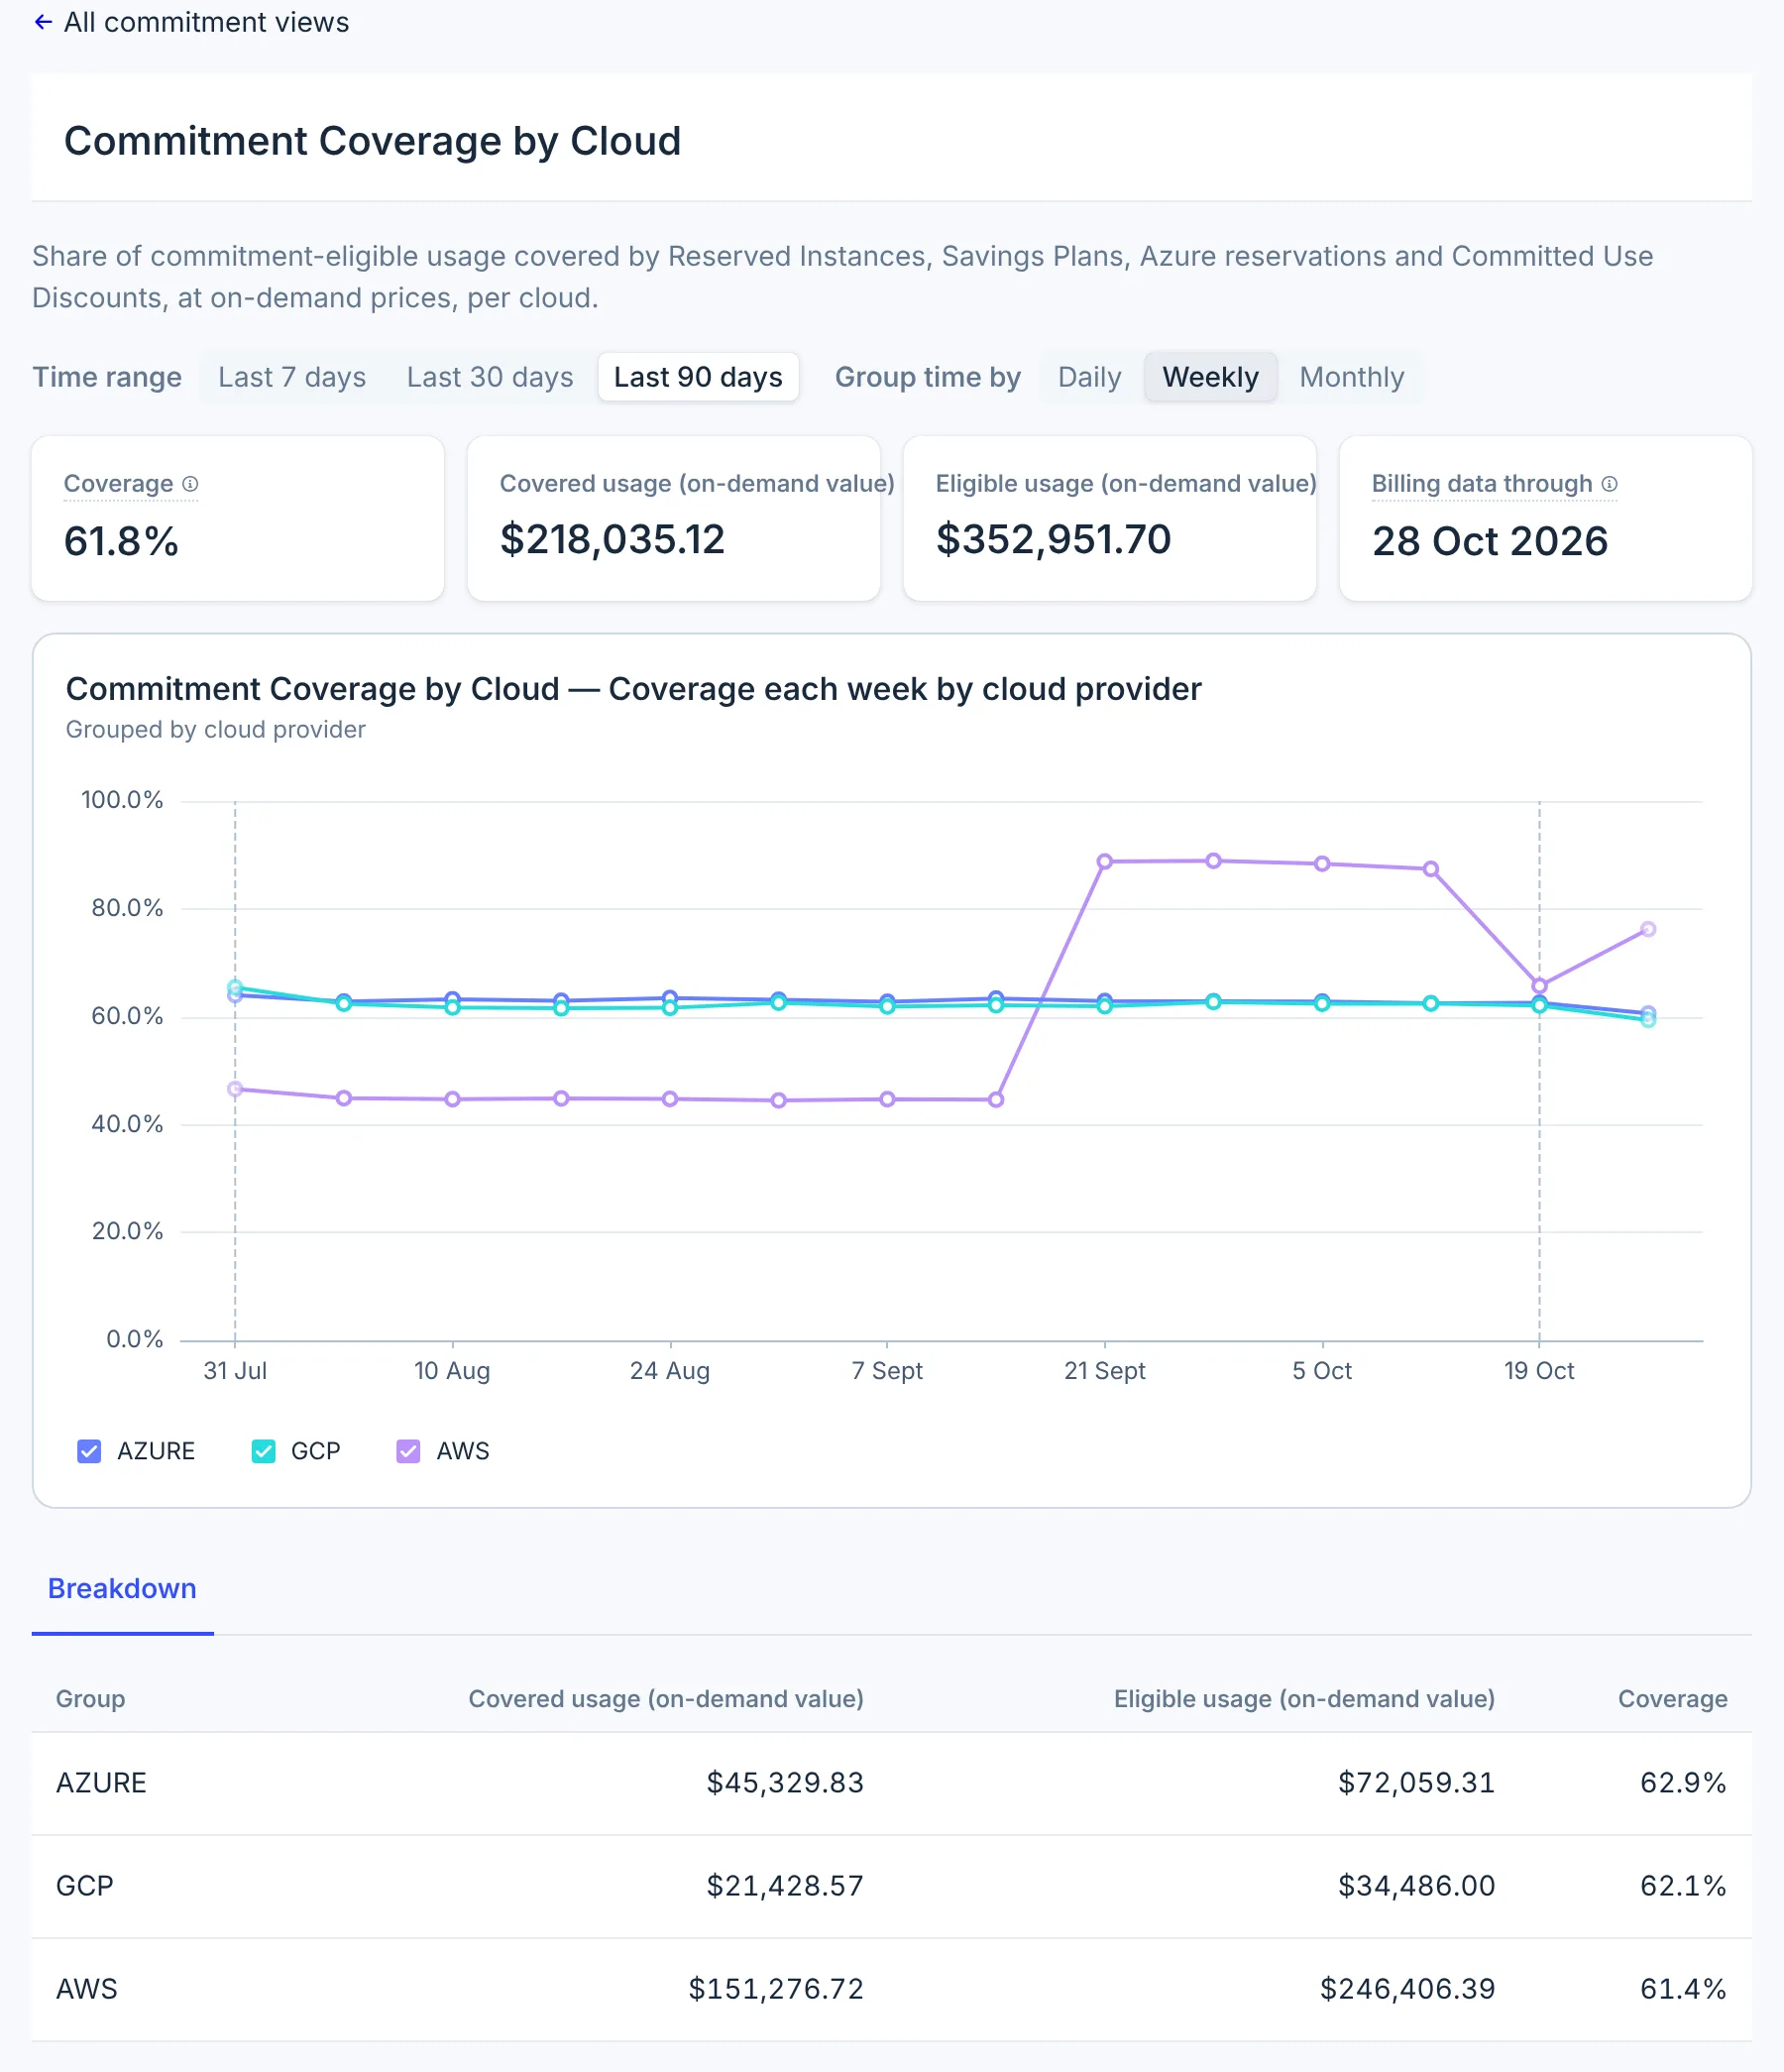
- Calculation: covered usage ÷ eligible usage, at on-demand prices, per cloud.
- Includes: all commitment types on all three clouds.
- How to read it:
- A rising line means more usage is covered, usually after a new purchase. In the example, AWS coverage rises from 45% to 89% in the week of 21 September, when a Savings Plan was added.
- A falling line means on-demand usage is growing faster than commitments, or a commitment expired. In the example, AWS coverage falls to 66% in the week of 19 October, when a load test ran on-demand.
- What to do: for steady workloads with falling coverage, consider new commitments. Cost Savings recommends specific purchases. Check utilization before buying, so you don't add commitments you won't use.
Commitment Coverage by Service
Shows coverage for each service, such as AmazonEC2, AmazonRDS, Virtual Machines and Compute Engine.
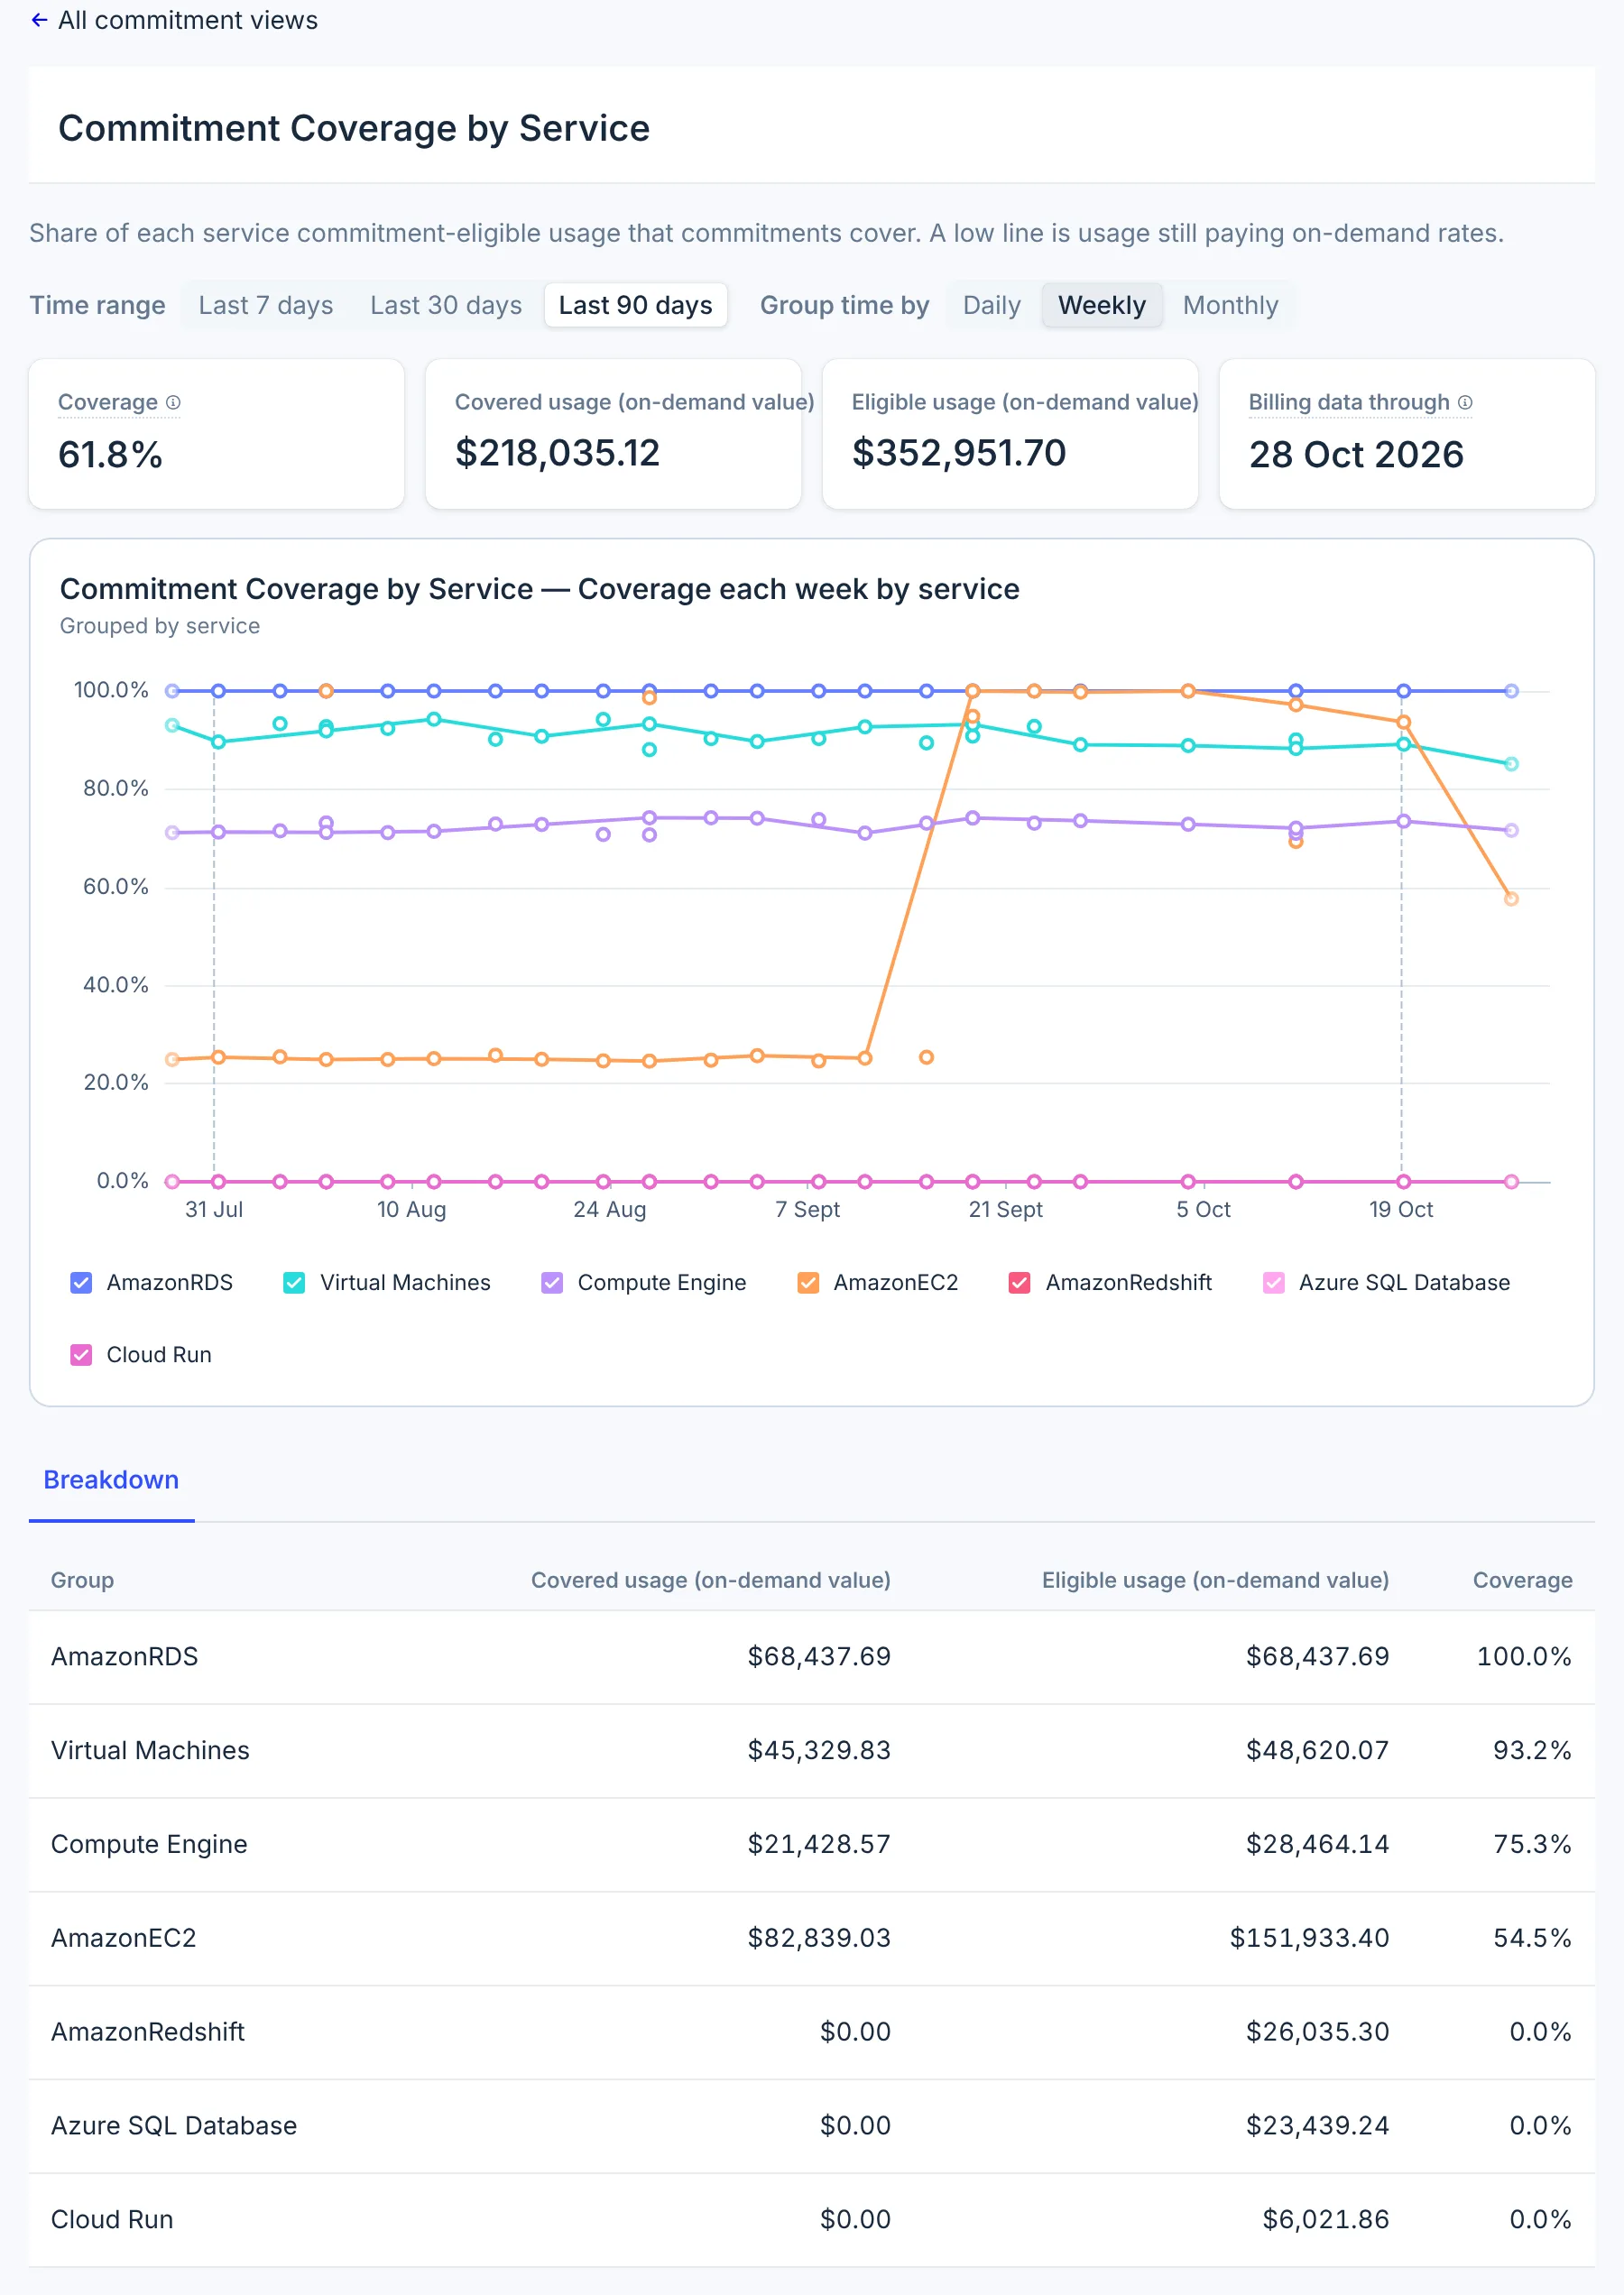
- Calculation: covered usage ÷ eligible usage, per service.
- How to read it:
- 0% means the service has eligible usage but no commitment. In the example, AmazonRedshift, Azure SQL Database and Cloud Run have 0% coverage.
- 100% means all eligible usage is covered. Check utilization as well: in the example, RDS has 100% coverage but 95.7% Reserved Instance utilization, which means it is slightly over-committed.
- One commitment can cover several services. A Compute Savings Plan covers EC2, Fargate and Lambda.
- What to do: start with services that have high eligible usage and low coverage.
Commitment Utilization by Type
Shows the share of each commitment type that your usage consumed.
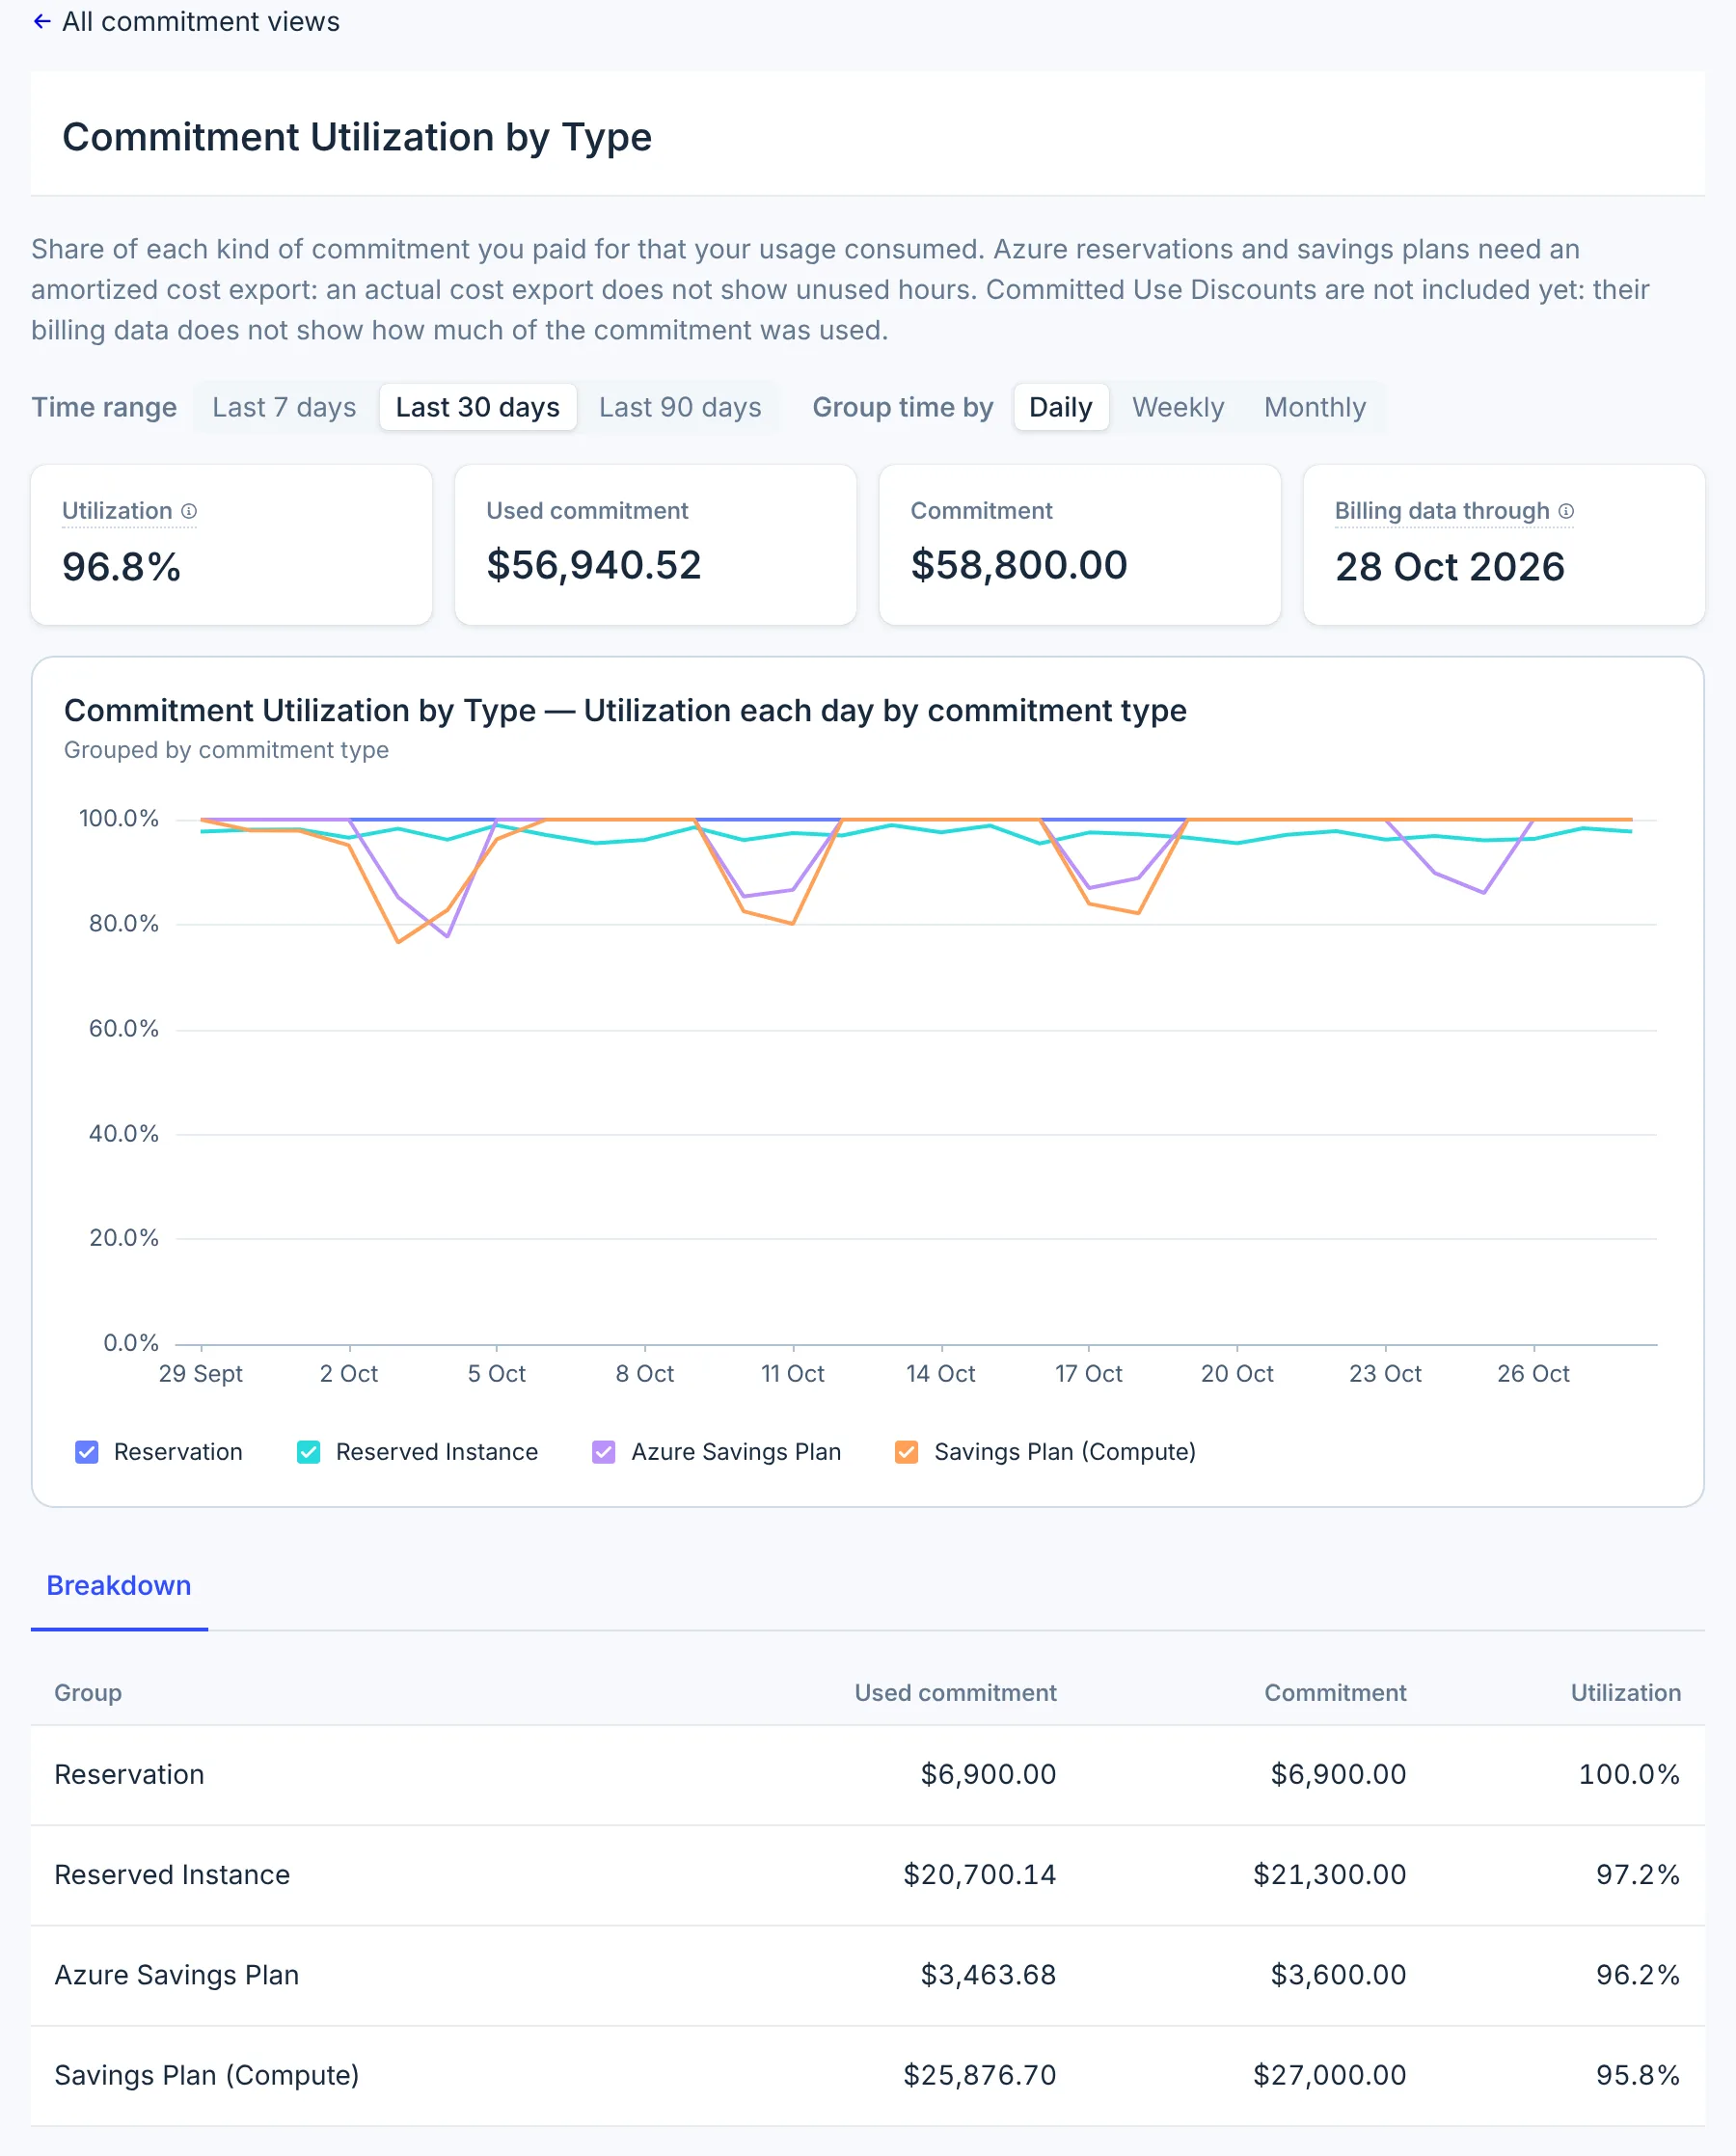
- Calculation: used commitment ÷ total commitment, per commitment type.
- Includes: AWS Reserved Instances and Savings Plans, Azure reservations and savings plans. Google Cloud CUDs are not included, because Google Cloud billing data does not report CUD usage. Azure needs the amortized cost export (see billing data requirements).
- How to read it:
- Close to 100% means the commitment is fully used.
- A weekly pattern with lower values on weekends means capacity is idle when fewer servers run. In the example, the Compute Savings Plan drops to about 80% on weekends.
- A steady decline means workloads moved, shrank or changed instance type.
- What to do: move steady workloads onto committed capacity, or size the next commitment to your regular usage instead of your peak usage.
AWS Reserved Instance Utilization by Service
Shows AWS Reserved Instance utilization for each service, such as EC2, RDS, ElastiCache, OpenSearch and Redshift.
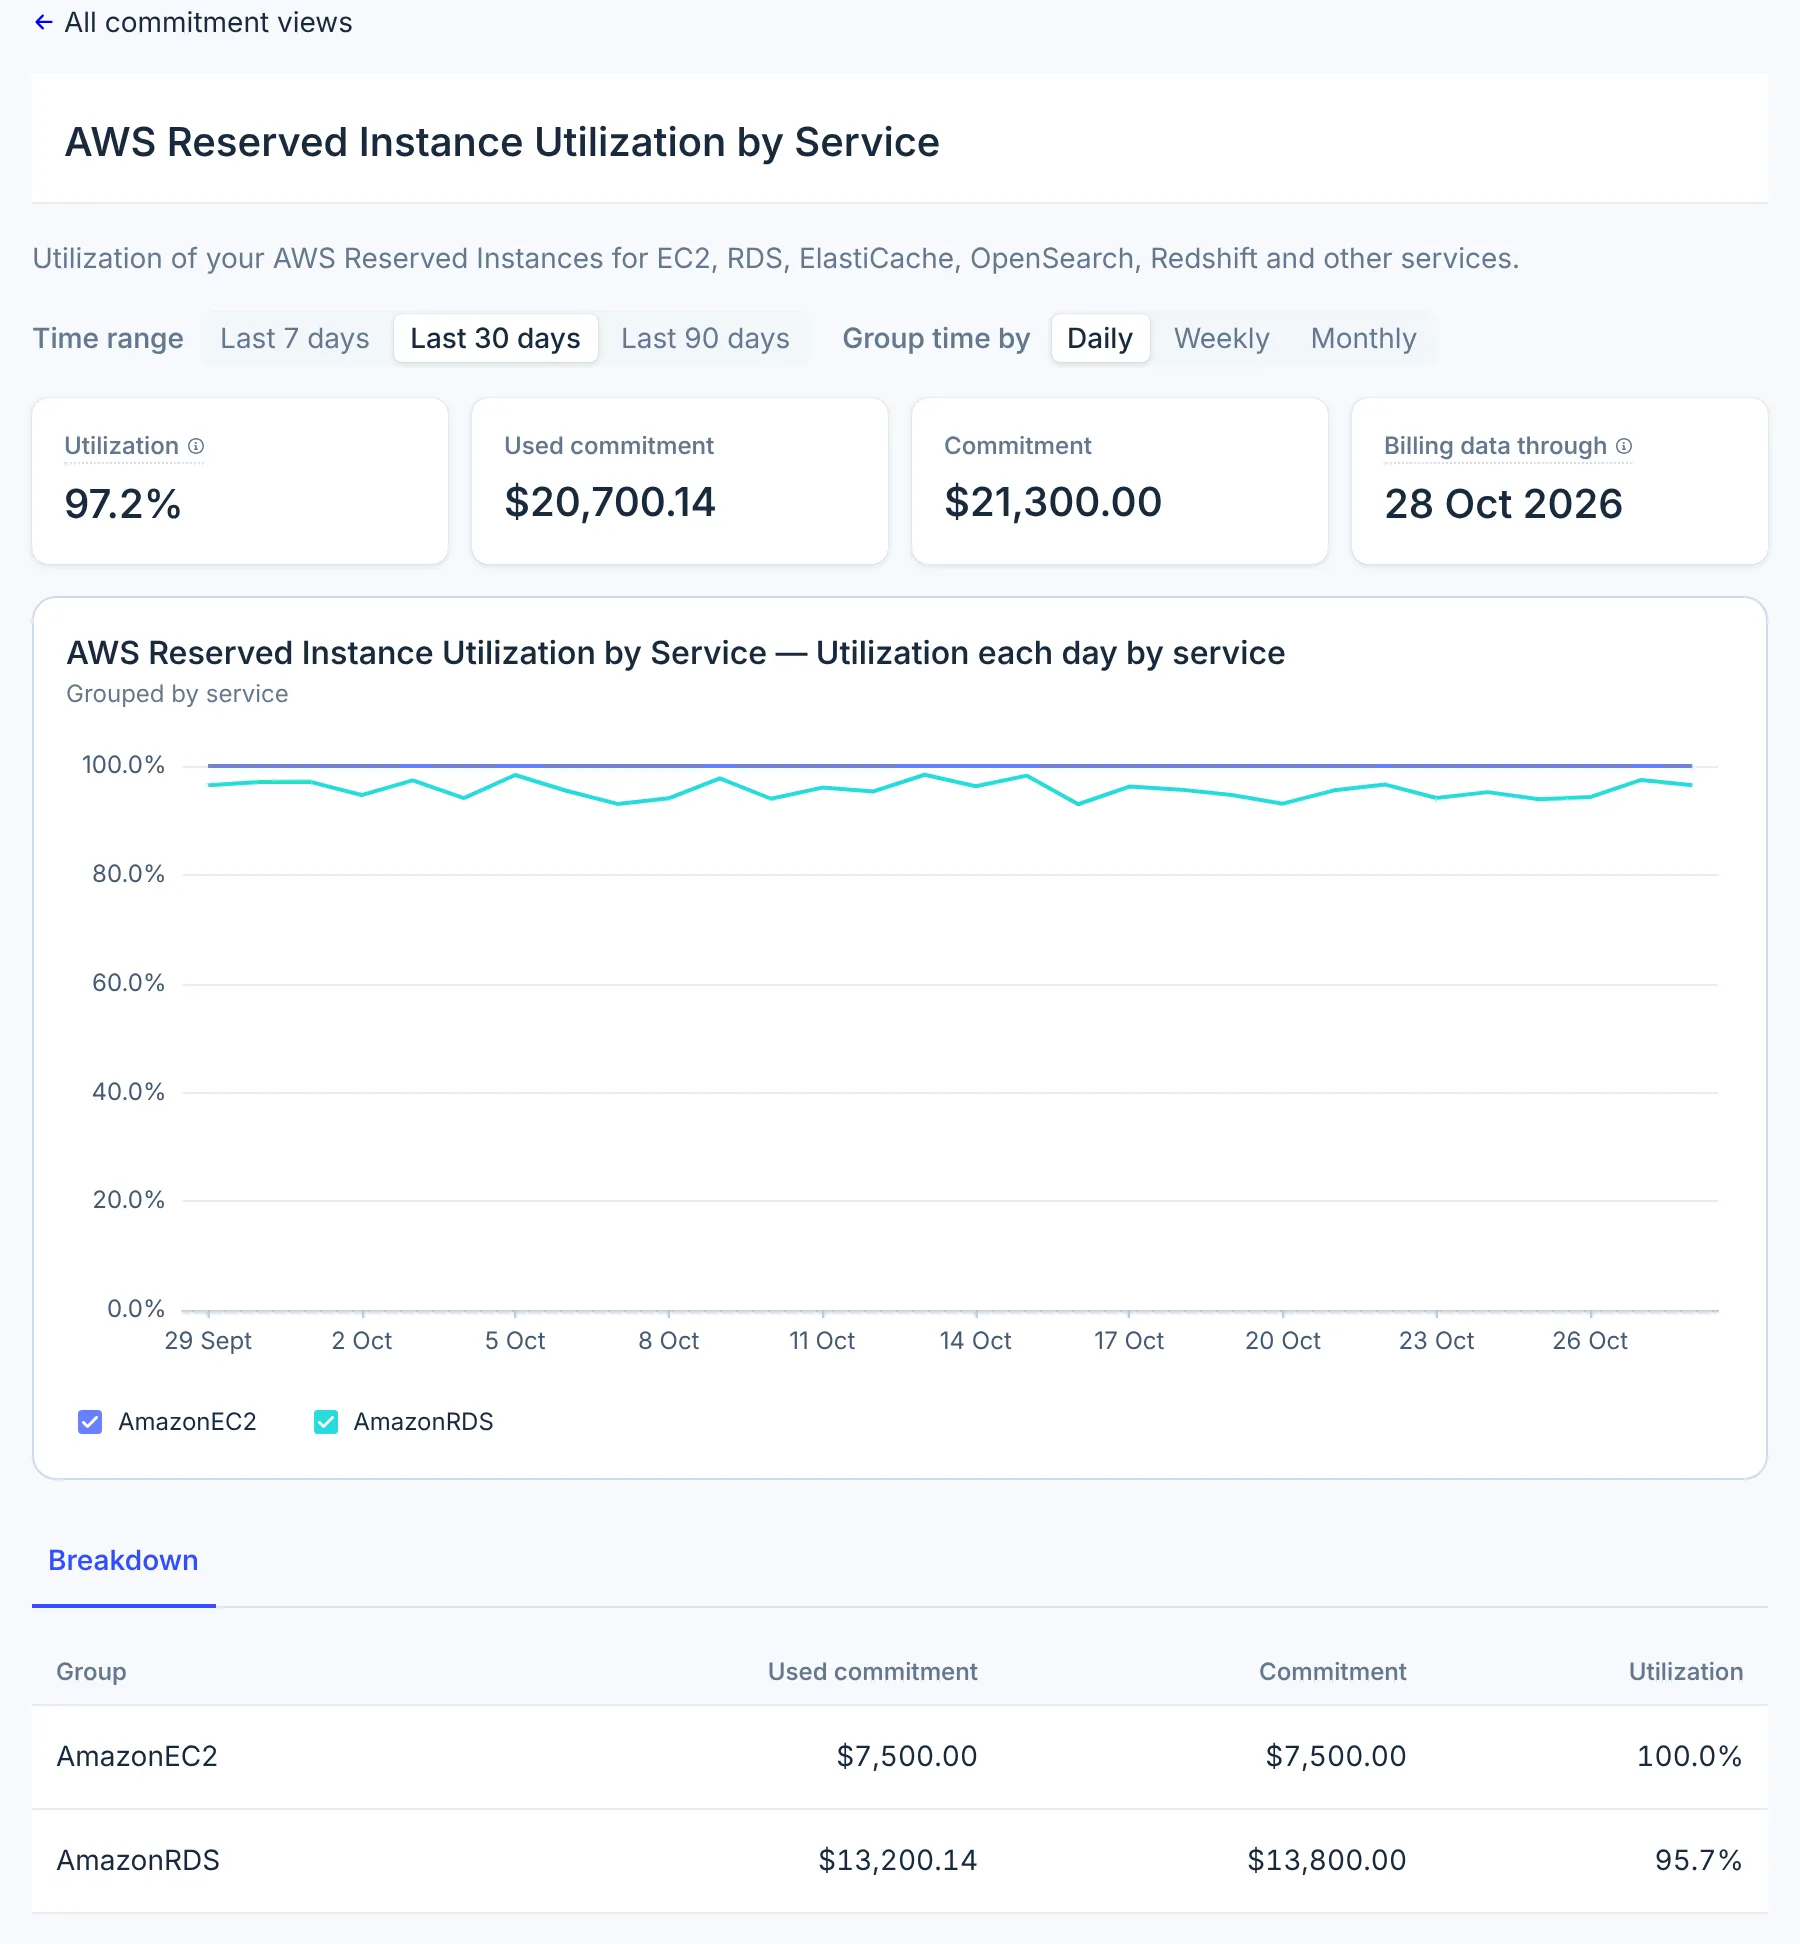
- Calculation: used commitment ÷ total commitment, per service. Each reservation's monthly fee and upfront payment are spread over the days it is active.
- How to read it: in the example, EC2 Reserved Instances are 100% used and RDS Reserved Instances are 95.7% used. A sudden drop often means instances were stopped, resized or moved to an instance family the reservation does not cover.
- What to do:
- Convertible EC2 Reserved Instances can be exchanged for another instance family, size or operating system.
- Standard EC2 Reserved Instances can be sold on the Reserved Instance Marketplace.
- Most database Reserved Instances, such as RDS and ElastiCache, can't be exchanged or sold. Match your instances to the reservations, or let them expire.
Unused Commitment by Type
Shows the dollar value of commitment you paid for but did not use, per commitment type. This view is also in the Optimization collection.
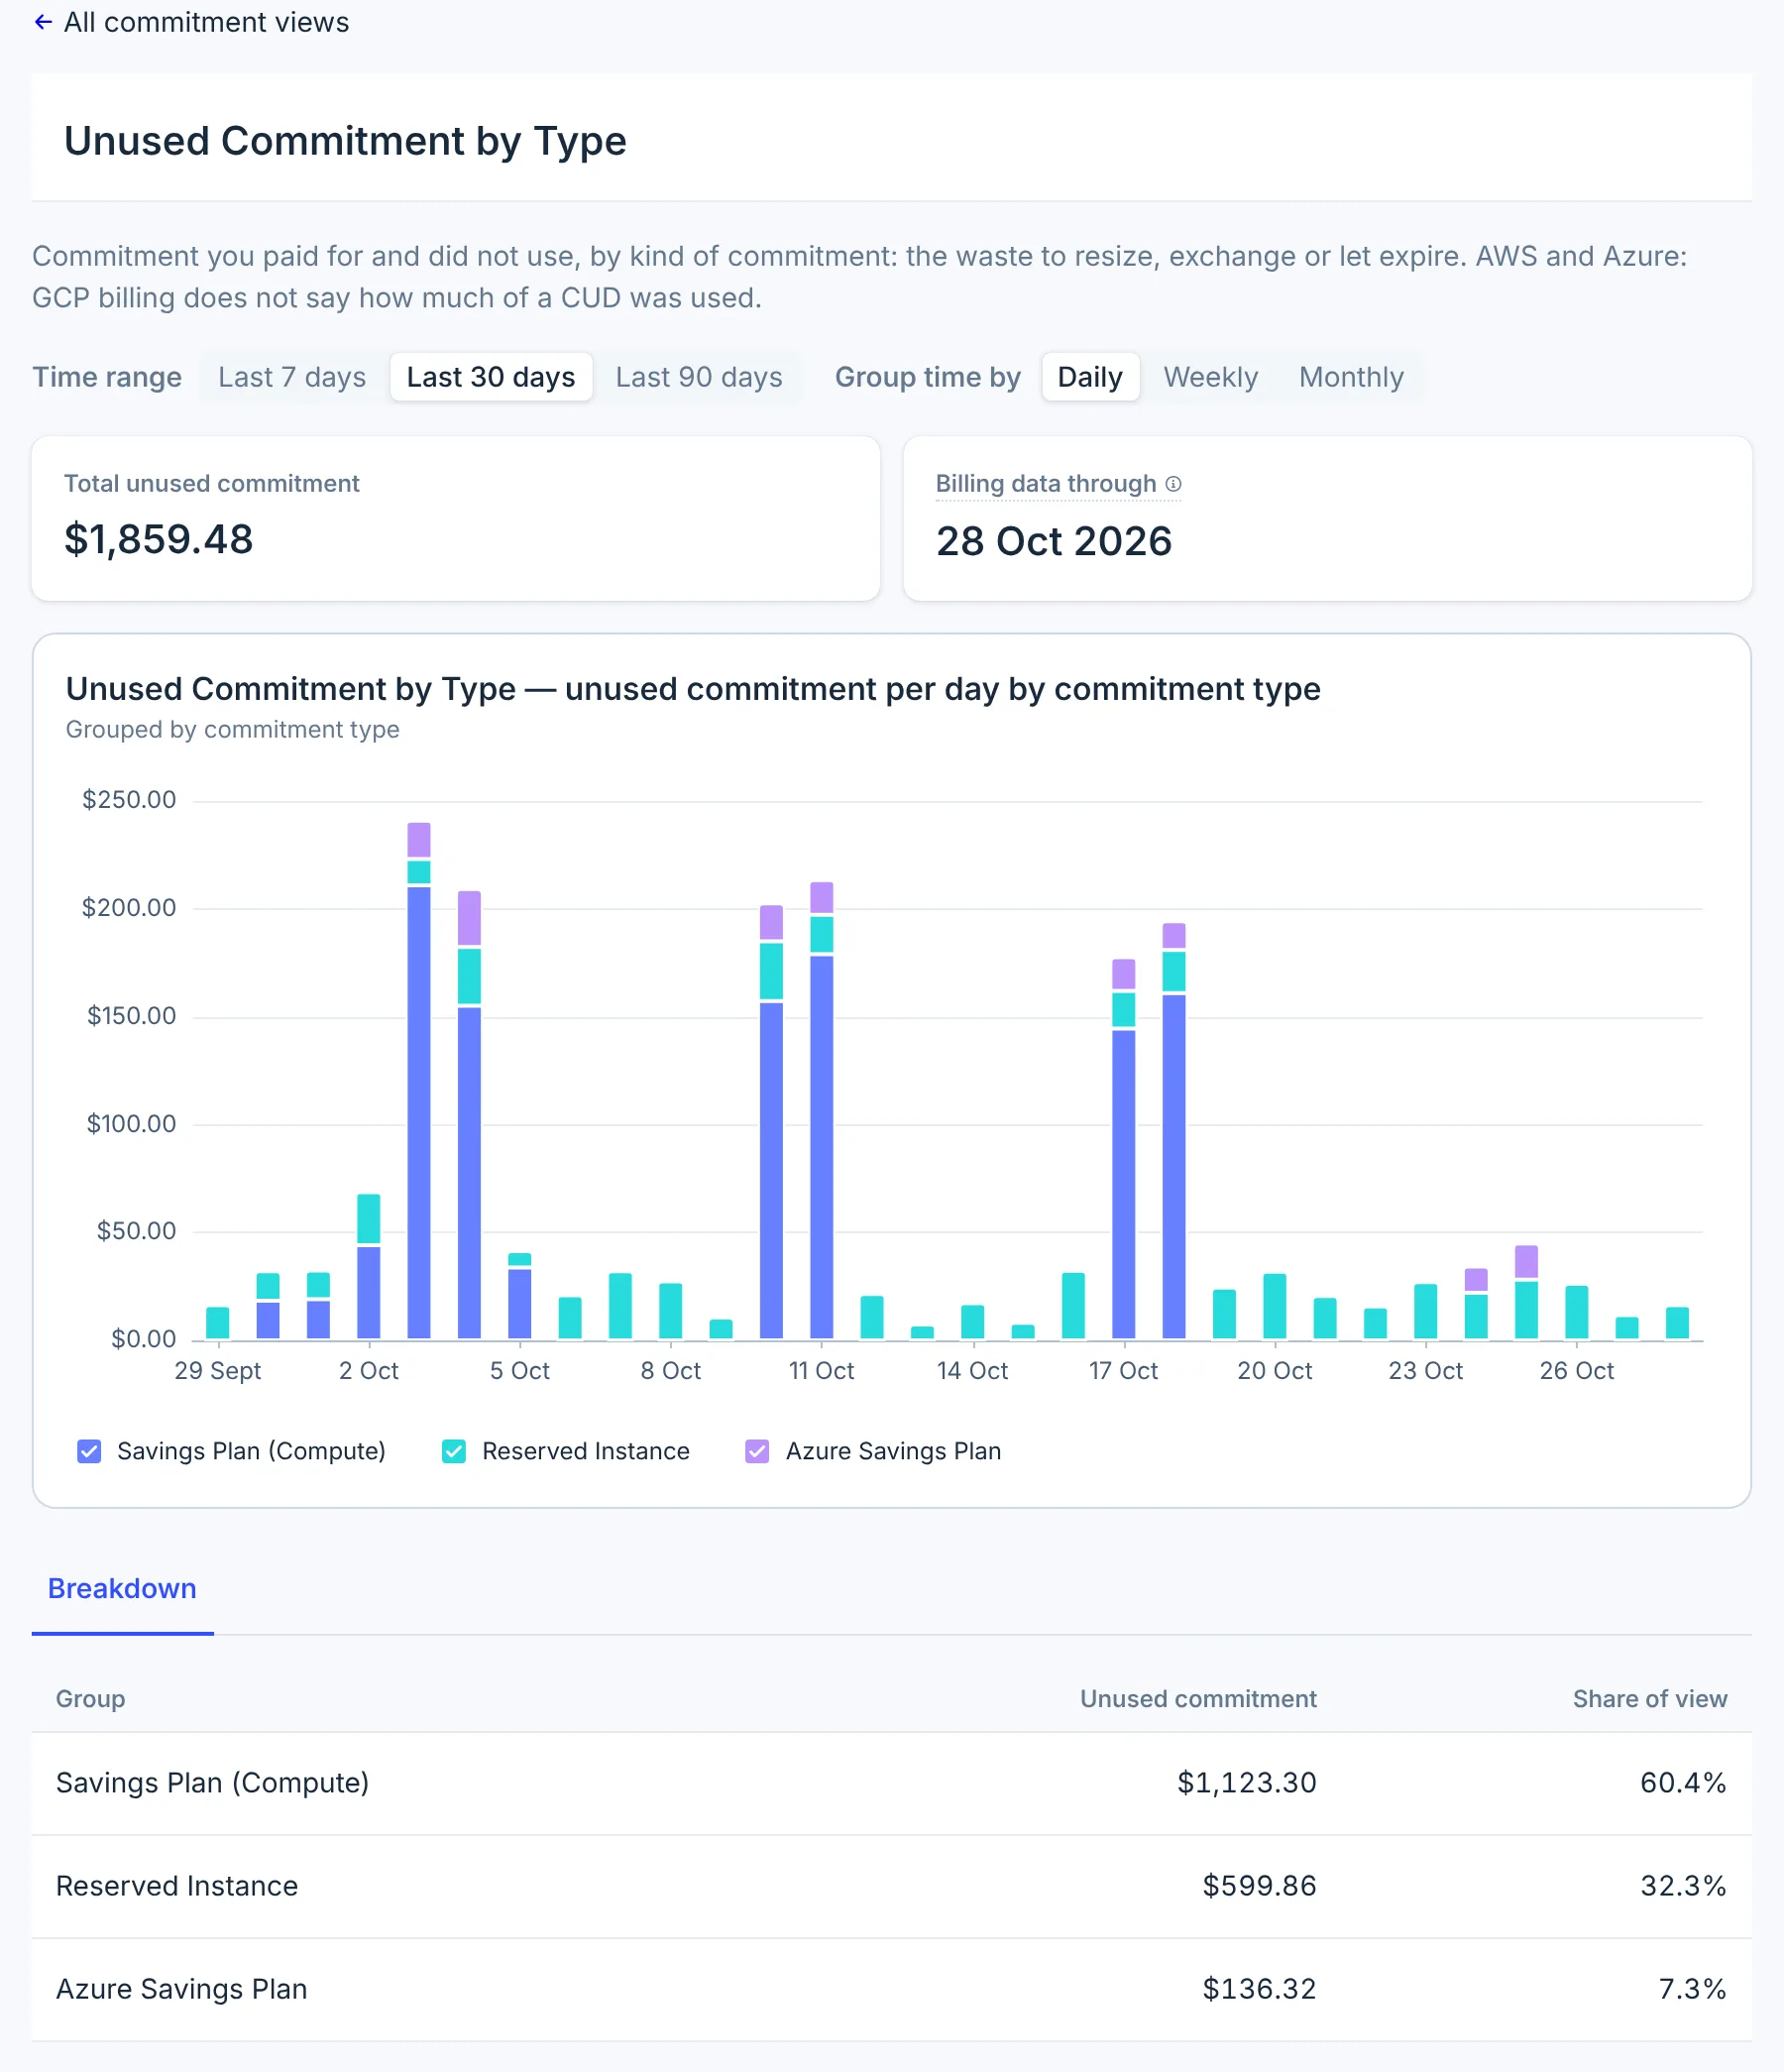
- Calculation: total commitment − used commitment, per commitment type. The Share of view column shows each type's share of the total.
- Includes: AWS Reserved Instances and Savings Plans, Azure reservations and savings plans. Not available for Google Cloud.
- How to read it: in the example, $1,859 went unused in 30 days. The Compute Savings Plan ($1,123) and Reserved Instances ($600) account for about 93% of it. The tallest bars are weekends.
- What to do: use this view to decide where to act first, then use the utilization views to find the cause.
Commitment Savings by Type
Shows how much each commitment type saved compared with on-demand prices, after the cost of the commitment.
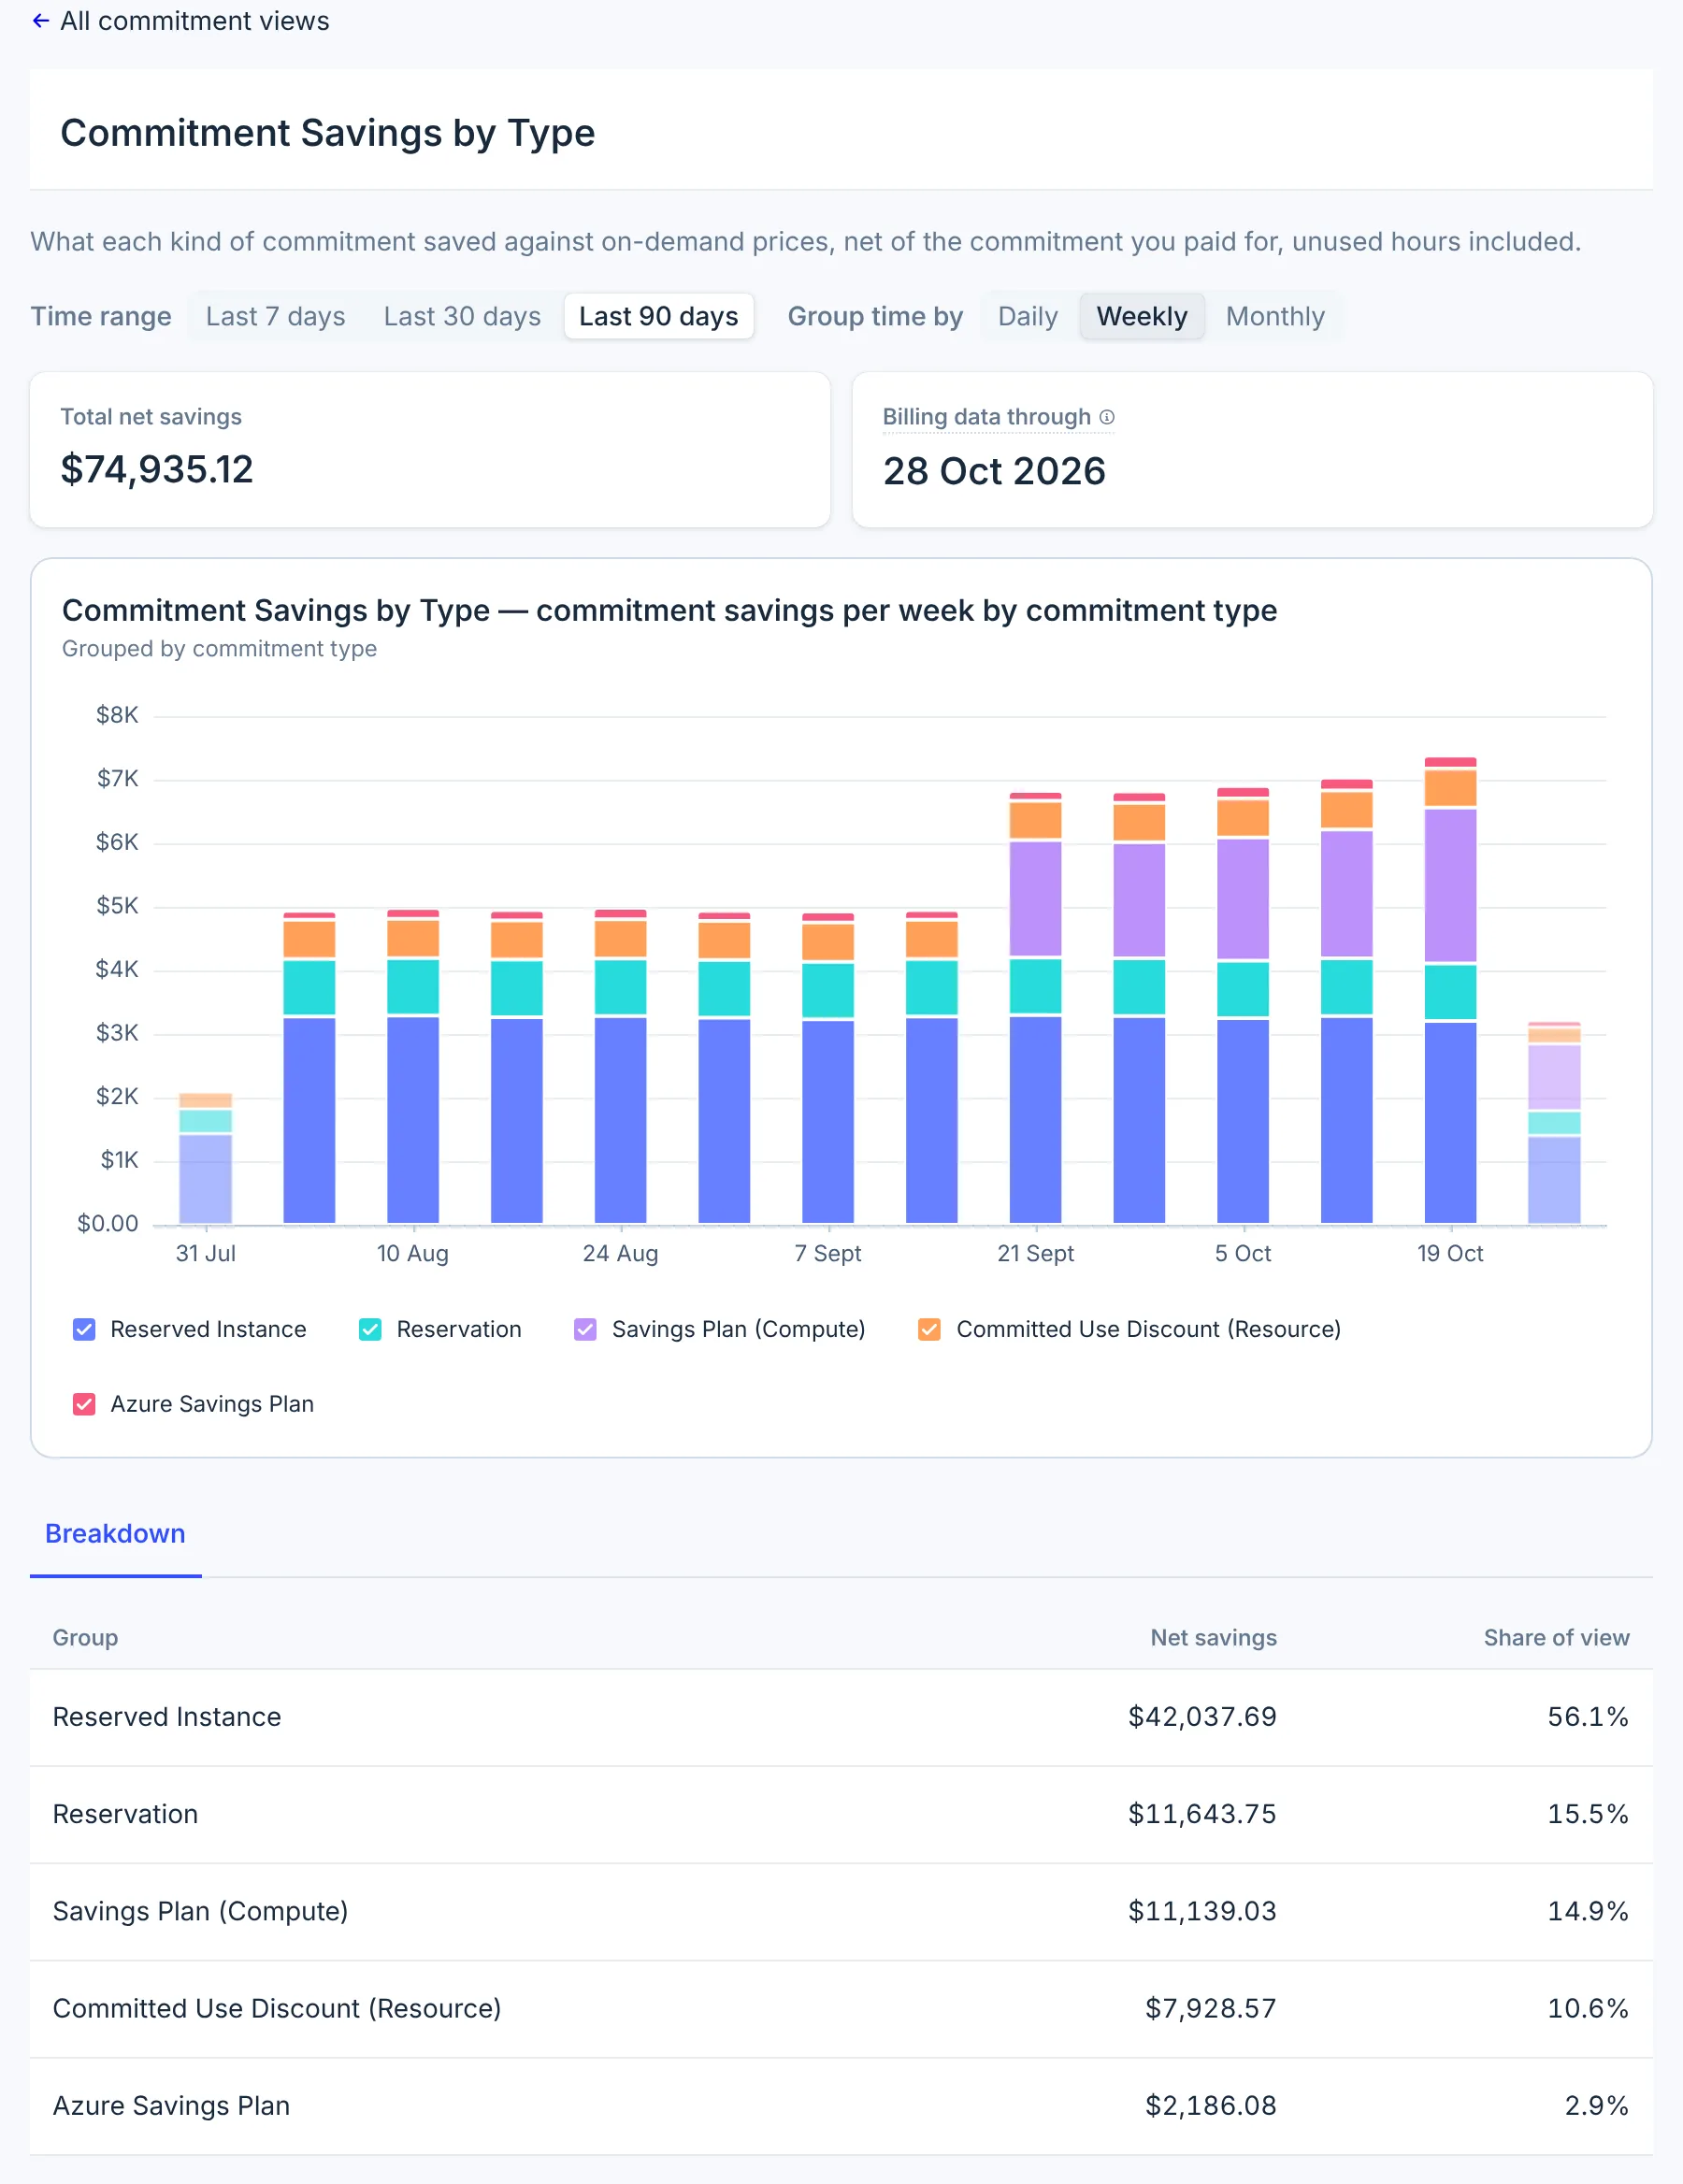
- Calculation: on-demand value of covered usage − commitment cost, including unused commitment.
- Includes: all commitment types on all three clouds.
- How to read it: in the example, commitments saved $74,935 in 90 days, and Reserved Instances saved 56% of that. A negative value means the commitment cost more than the usage it covered would have cost on-demand, which usually means low utilization.
- What to do: use it to report the value of your commitments and to check that a new purchase paid off.
Effective Savings Rate by Cloud
Shows net savings as a percentage of what all eligible usage would cost on-demand, per cloud.
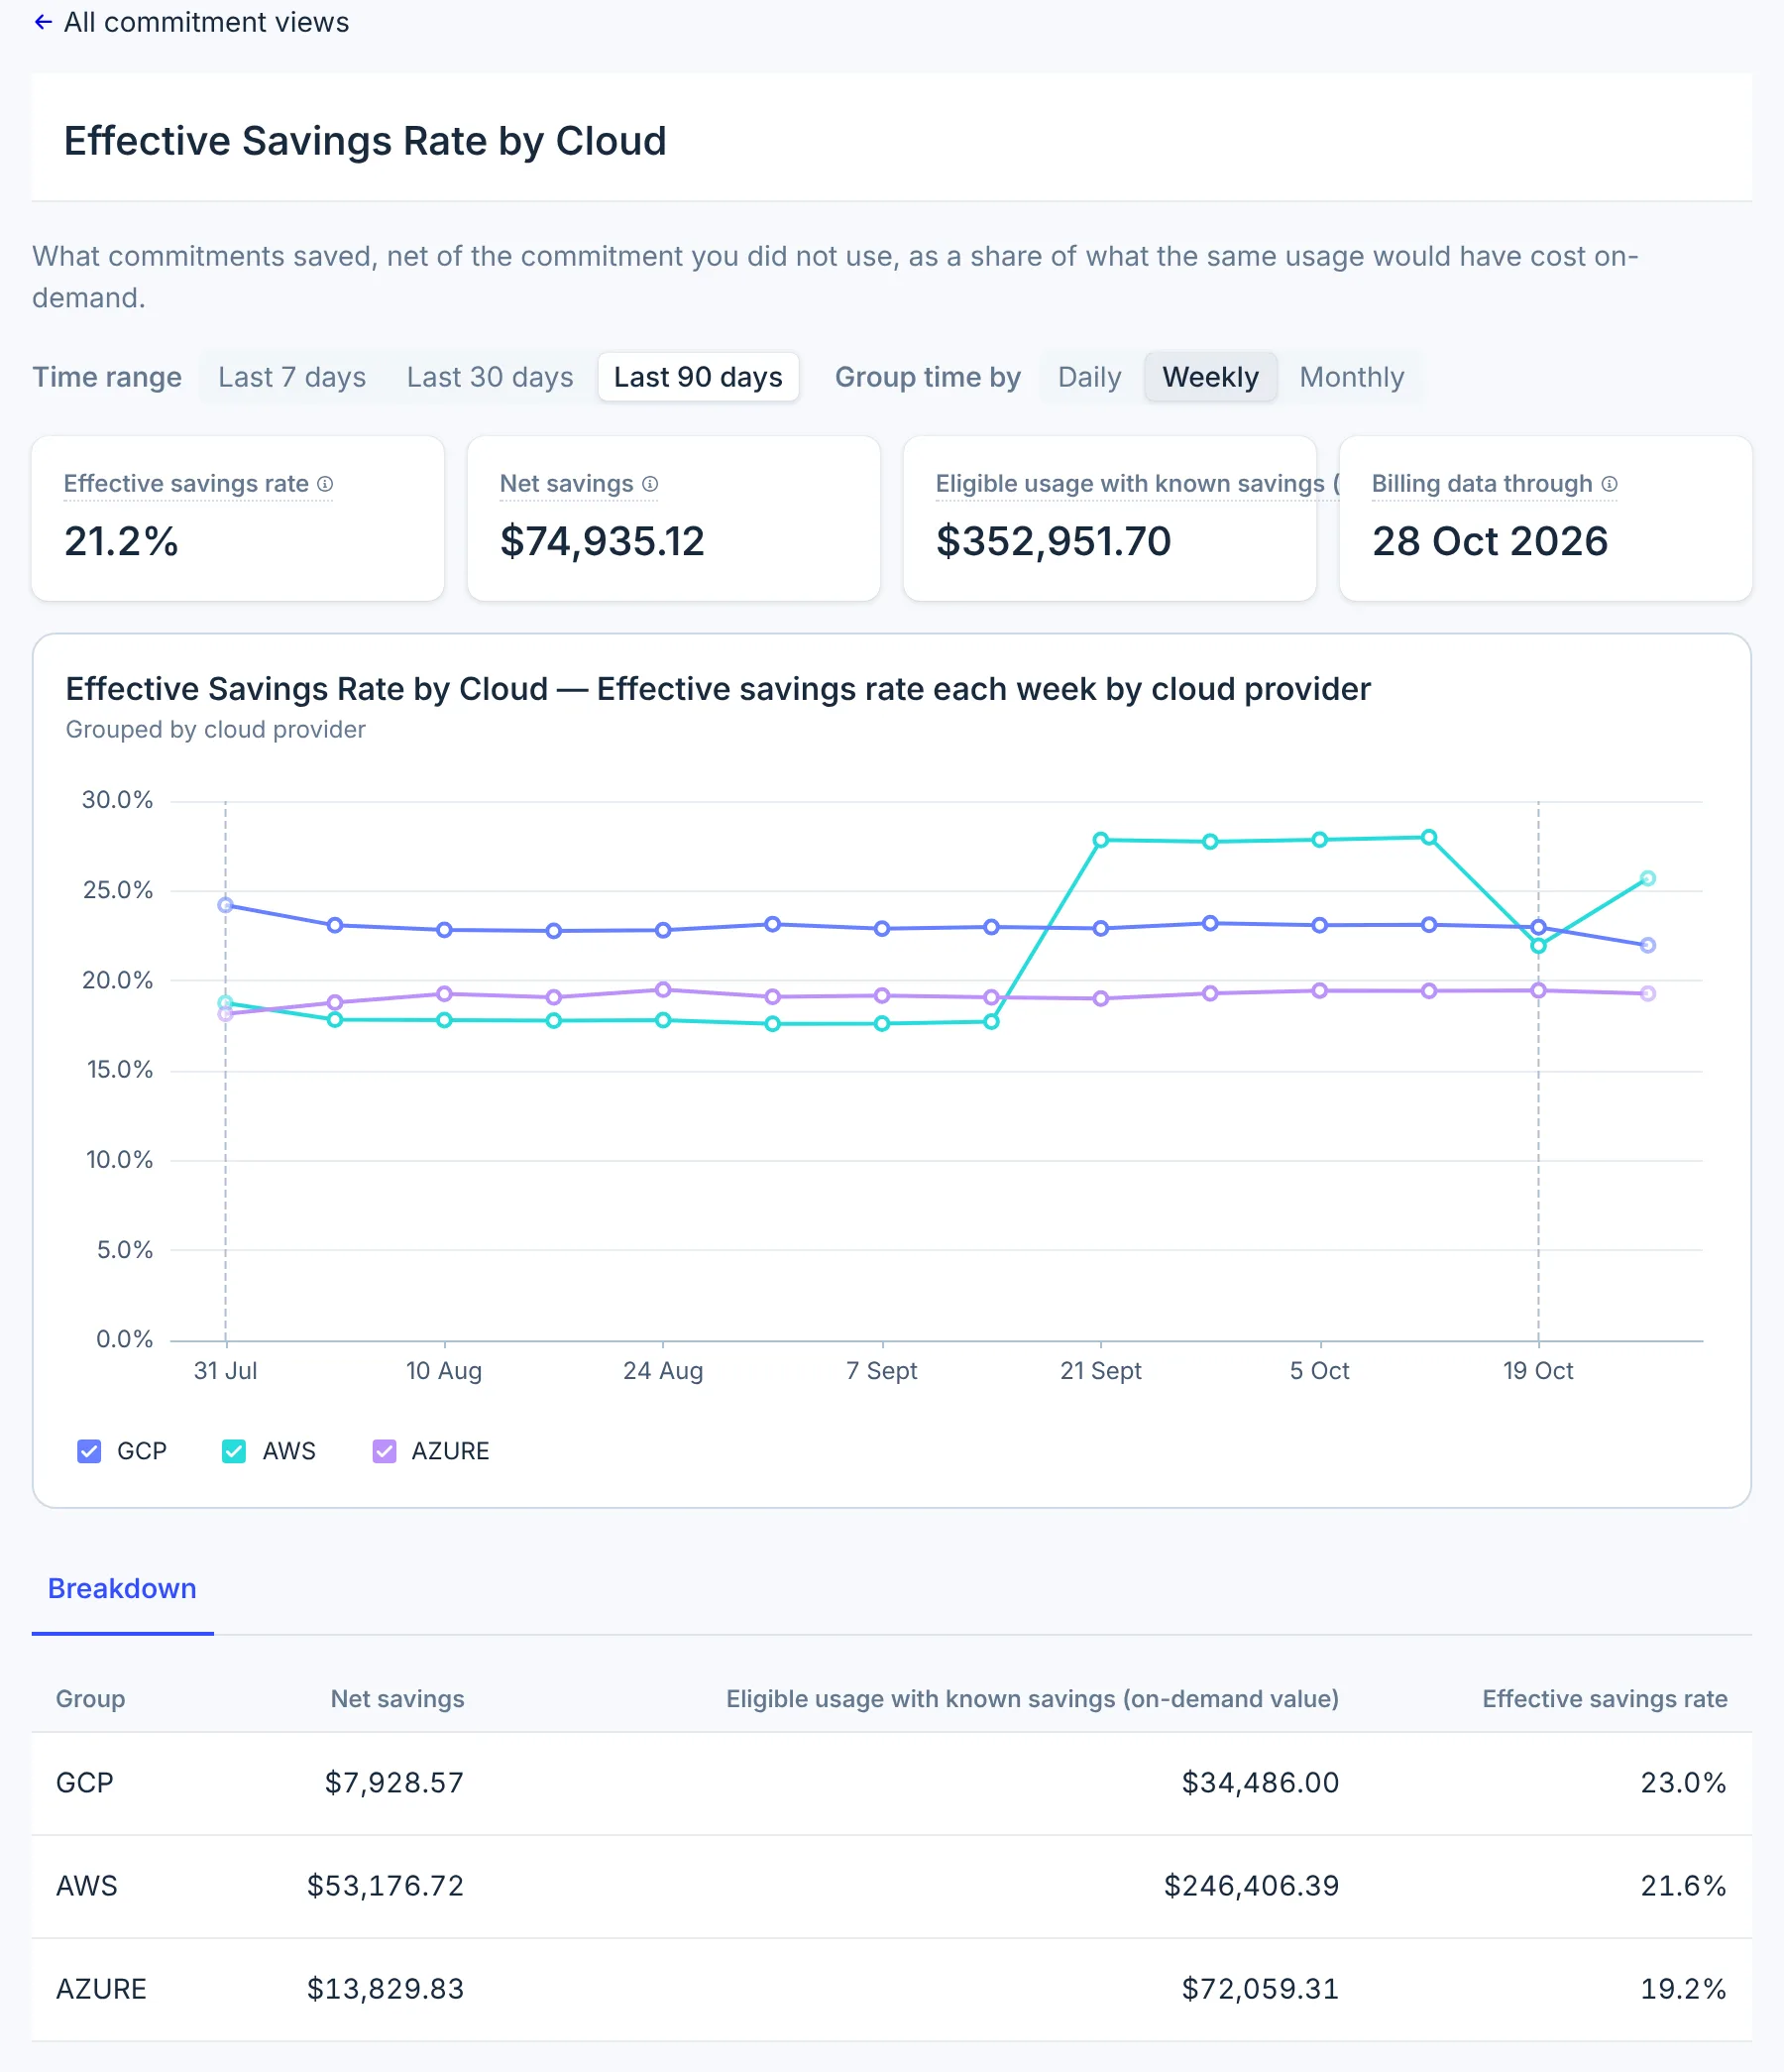
- Calculation: net savings ÷ eligible usage, at on-demand prices, per cloud. Days whose savings aren't known yet are left out of both sides, so the tile next to the rate is labelled Eligible usage with known savings.
- Includes: all commitment types on all three clouds.
- How to read it: ESR combines coverage, utilization and discount depth in one percentage. In the example, Google Cloud ESR is 23%, AWS is 22% and Azure is 19% over 90 days, and AWS rises from 18% to 28% in the week its Savings Plan starts. ESR goes up when coverage goes up, when less commitment is unused, or when the discount is deeper.
- What to do: track ESR monthly per cloud. When ESR is low, check coverage and utilization to find the cause.
What billing data does each cloud need?
| Cloud | Billing data | Coverage | Utilization and unused commitment | Net savings and ESR |
|---|---|---|---|---|
| AWS | Cost & Usage Report, connected during AWS onboarding | Yes | Yes | Yes |
| Azure | Cost Management export (setup) | Yes | Amortized export only | Amortized export only |
| Google Cloud | BigQuery billing export, connected during GCP onboarding | Yes | No | Yes |
- Azure: an actual cost export shows reservation usage at $0 and does not include unused hours.
Only amortized cost data includes them, as
UnusedReservationandUnusedSavingsPlancharges. With an actual cost export, Azure coverage is correct, and the other metrics show gaps for Azure. - Google Cloud: billing data shows what a CUD saved, but not how much of the CUD was used, so Google Cloud utilization and unused commitment are not available. Both spend-based CUD billing models are supported: the credit model, and the discounted-price model that Google Cloud applied to all billing accounts in January 2026.
Limits
- Shared commitments. A commitment bought in one account can cover usage in other accounts. Coverage is reported on the account that used the commitment. Commitment cost, utilization and unused commitment are reported on the account that owns it, usually the payer or management account.
- History. Commitment details are collected from billing data loaded after commitment tracking was turned on. Earlier days show gaps until that billing data is reprocessed. Contact support@cloudyali.io if you need older history.
- Unknown commitment cost. If the cost of any commitment on a cloud is unknown for a day, net savings and ESR for that cloud show a dash for that day, rather than a figure calculated from incomplete data.
- Linked-account Cost & Usage Reports. A linked account's own CUR includes the usage that its payer's commitments covered, but not the commitment fees, which are on the payer's bill. Coverage is correct, but net savings and ESR show a dash. Connect the payer (management) account's CUR to see them.
- Read-only. The views are built in and can't be edited.
- Not available yet: a list of individual commitments with their terms and expiry dates.
FAQ
What is commitment coverage?
Commitment coverage is the percentage of your commitment-eligible cloud usage that a Reserved Instance, Savings Plan, Azure reservation or Google Cloud committed use discount covered. CloudYali calculates it as covered usage divided by eligible usage, both valued at on-demand prices.
What is the difference between commitment coverage and utilization?
Coverage measures how much of your usage is covered by commitments. Utilization measures how much of your commitments your usage consumed. High coverage with low utilization means you bought more commitment than you use. High utilization with low coverage means more usage could be committed.
How is the effective savings rate (ESR) calculated?
The effective savings rate is net savings divided by the on-demand cost of all eligible usage. Net savings is the on-demand value of covered usage minus the cost of the commitments, including commitment that went unused. For example, $240 of net savings on $1,000 of eligible usage is an ESR of 24%.
What is a good commitment coverage or utilization target?
There is no single target. Steady workloads can support high coverage, while usage that is temporary, spiky or about to change is usually cheaper on-demand. Keep utilization high first, then raise coverage for usage you expect to keep for the whole commitment term.
Why is CloudYali commitment coverage different from AWS Cost Explorer?
AWS Cost Explorer reports Reserved Instance coverage in hours by default. CloudYali reports coverage in on-demand dollars, so larger instances count for more, and Reserved Instances and Savings Plans are combined in one number.
Why is Azure utilization blank in CloudYali?
Azure utilization, unused commitment, net savings and effective savings rate need the Azure amortized cost export. An actual cost export does not include unused reservation and savings plan hours. Azure coverage works with either export.
Does CloudYali show utilization for Google Cloud CUDs?
No. Google Cloud billing data does not report how much of a committed use discount was used. Google Cloud CUDs are included in coverage, net savings and effective savings rate.
How often is commitment data updated?
Commitment data is updated once a day, after the billing data for AWS, Azure and Google Cloud arrives. Cloud providers finalize billing one to two days late, so the most recent days can still change.
Do I need to set anything up to track commitments in CloudYali?
No. The Financial Commitments views use the billing data you already connected to CloudYali. For Azure utilization and savings, CloudYali needs to read your amortized cost export.
Can I see individual Reserved Instances or Savings Plans and their expiry dates?
Not yet. The Financial Commitments views report totals by cloud, service and commitment type. A list of individual commitments with terms and expiry dates is not available yet.
Related
- Cost Views: how views, collections and groups work.
- Cost Savings: savings recommendations, including commitment purchases.
- Azure Cost Management setup: actual and amortized cost exports.