CloudYali Dashboard Overview
Filters
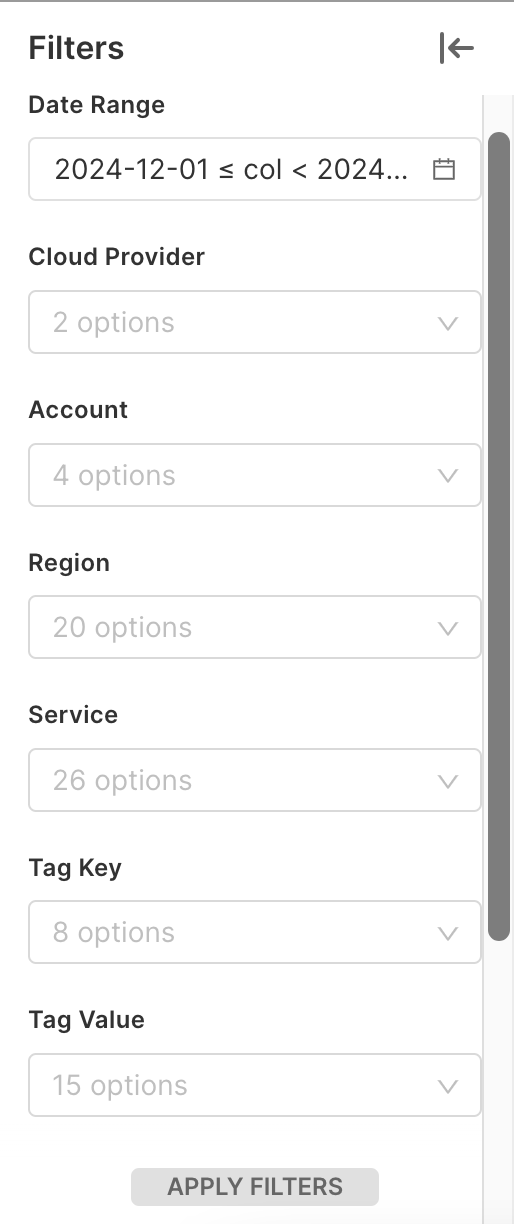
The Filters panel, located on the left-hand side of the CloudYali Dashboard, provides several options to refine and customize the data displayed. Using filters allows you to focus on specific aspects of your cloud costs, making it easier to gain insights and take action. Below are the supported filters and their functions:
| Filter Type | Description |
|---|---|
| Date Range | Select a start and end date to view cloud spending data for a specific period. This helps you analyze costs over custom time frames. |
| Cloud Provider | Choose between different cloud providers (e.g., AWS, GCP) to filter costs by provider. This allows you to see which provider contributes the most to your spending. |
| Account | Select a specific cloud account to see costs associated with that account. This helps to understand the spending per account, especially if multiple accounts are in use. |
| Region | Filter data based on geographical regions (e.g., US East, EU West) to analyze regional spending. This is useful for identifying which regions have higher costs. |
| Service | View spending by specific cloud services (e.g., EC2, S3, BigQuery) to determine which services contribute most to your cloud costs. |
| Tag Key | Use tag keys to categorize resources based on specific attributes such as department, environment, or project. This helps in organizing and attributing costs more effectively. |
| Tag Value | Use tag values to further refine cost data, enabling precise tracking of costs related to specific projects or teams. |
These filters can be combined to create a customized view of your cloud spending, allowing you to focus on specific aspects of your infrastructure and make more informed decisions.
Below is an image showing the Filters panel as it appears on the CloudYali Dashboard:

Summary View
The Summary tab provides a quick overview of your cloud costs for the selected date range, across different cloud providers like AWS and GCP. The data is displayed in multiple widgets that summarize key cost metrics:
Total Cost by Cloud Provider
- Cloud Provider Cost Breakdown: This section provides a detailed breakdown of costs for each cloud provider. For example:
- AWS: $18.14
- GCP: $3.30
- Total Cost: $21.44
The cost distribution is visually represented using a bar, making it easy to compare expenses between cloud providers.
Tagged and Untagged Costs
- Tagged Cost: Shows the total cost of resources that have proper tagging, which is useful for attributing costs to specific teams, projects, or environments.
- Untagged Cost: Represents the cost associated with resources that have no tags applied. Keeping track of untagged resources helps in optimizing cost attribution.
Current Month Cost and Previous Month
- Current Month Cost: Displays the total cost incurred so far in the current month.
- Previous Month: Allows users to compare costs with the previous month. This comparison helps in understanding spending trends over time.
Cost Trend by Cloud Provider
The Cost Trend by Cloud Provider chart provides a visual representation of how costs have evolved over time, broken down by cloud providers such as AWS and GCP. Costs for each provider are displayed in different colors to distinguish between them.
Supported Filters
The CloudYali Dashboard offers a variety of filters to help you narrow down your cost analysis and get precise insights into your cloud spending. Below are the supported filters:
| Filter Type | Description |
|---|---|
| Date Range | Select a start and end date to view cloud spending data for a specific period. |
| Cloud Provider | Choose between different cloud providers (e.g., AWS, GCP) to filter costs by provider. |
| Account | Select a specific cloud account to see the associated costs. |
| Region | Filter data based on geographical regions (e.g., US East, EU West) to analyze regional spending. |
| Service | View spending by specific cloud services (e.g., EC2, S3, BigQuery) to determine which services contribute most to your costs. |
| Tag Key | Use tag keys to categorize resources based on specific attributes (e.g., department, environment). |
| Tag Value | Use tag values to further refine cost data, enabling precise tracking of costs related to specific projects or teams. |
These filters can be combined to create a customized view of your cloud spending, allowing you to focus on specific aspects of your infrastructure.
Key Features
- User-Friendly Interface: The dashboard's design is intuitive, with well-organized sections and visual indicators to help you easily track and analyze costs.
- Interactive Filters: Dynamic filtering capabilities enable you to drill down into cost data based on the parameters most relevant to your business.
- Comparative Analysis: The dashboard provides easy comparison of current and previous month expenses, allowing users to track and identify any significant cost changes.
Tips for Using the Dashboard
- Leverage Tagging: Proper tagging of resources is essential for accurate cost attribution. Use the Tagged vs. Untagged cost breakdown to identify areas for improvement.
- Compare Cloud Providers: Use the Total Cost by Cloud Provider to see how your spending is distributed across AWS and GCP, and identify any potential cost-saving opportunities.
- Utilize Filters: Apply filters to refine your view and focus on specific accounts, services, or regions. This helps in identifying which areas are contributing most to your cloud costs.
The CloudYali Dashboard provides the insights you need to manage your cloud costs effectively, with clear visualizations and filtering options that make it easy to understand and optimize your cloud spend.
For more details on using the platform or to explore advanced features, please refer to the Cost Optimization Guide.