CloudYali Cost Reports
CloudYali offers comprehensive cost reporting capabilities that help teams track, analyze, and optimize their cloud spending across multiple cloud providers including AWS and GCP. These reports deliver essential financial insights directly to your inbox, ensuring that all stakeholders stay informed about cloud spending patterns.
Types of Cost Reports
CloudYali provides two primary types of cost reports:
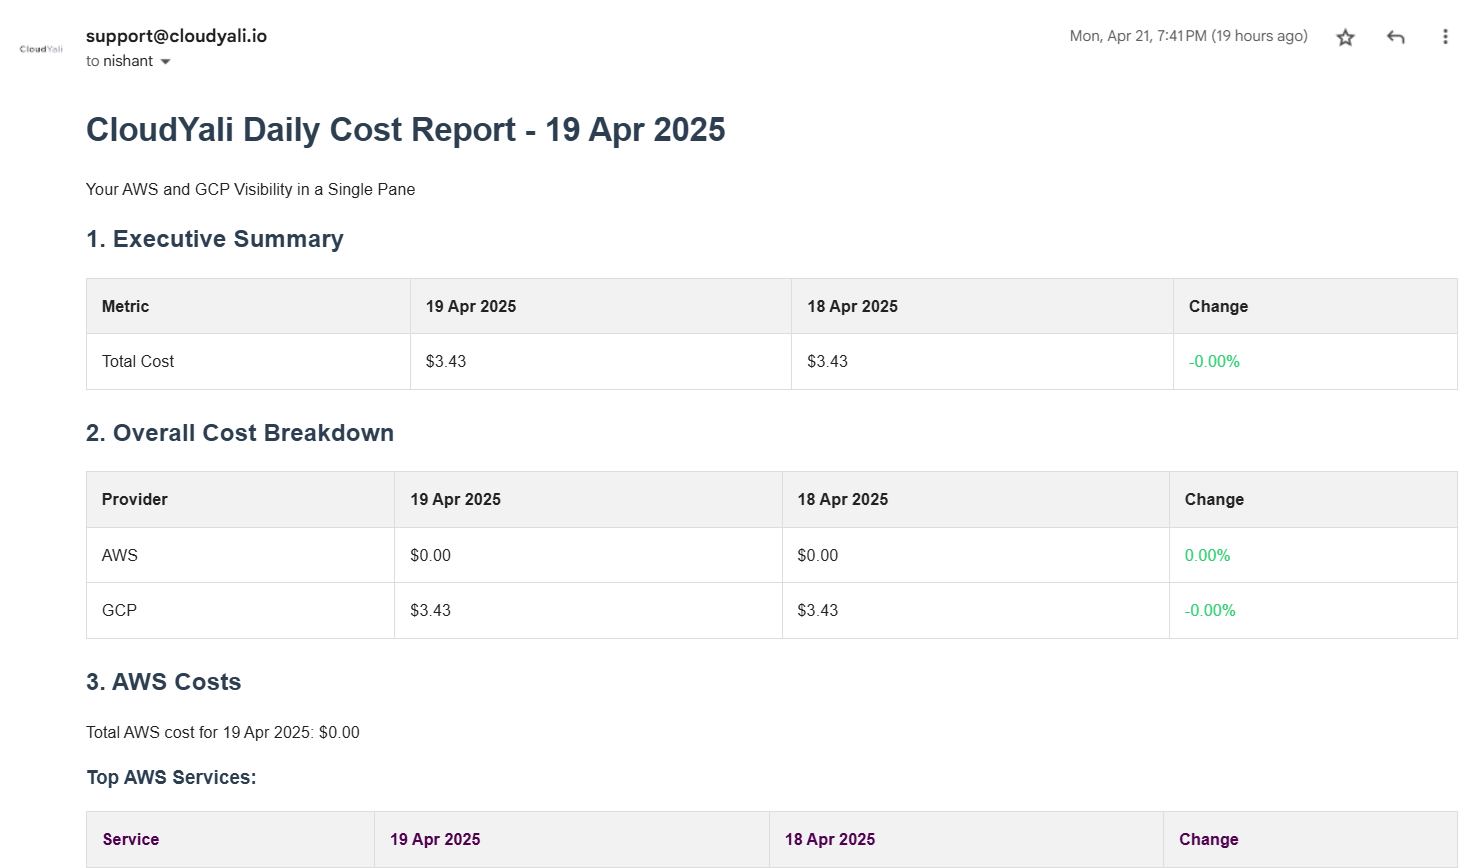
Daily Cost Reports
Daily reports provide a snapshot of your cloud spending for the previous day, allowing for quick identification of unexpected cost spikes or anomalies.

Key features of daily cost reports include:
- Executive Summary: High-level overview of total costs across all cloud providers
- Day-over-day Comparison: Shows cost changes compared to the previous day
- Provider Breakdown: Separate sections for AWS and GCP costs
- Top Services: Lists the most expensive services for each cloud provider
- Top Accounts/Projects: Highlights the highest-spending accounts or projects
Monthly Cost Reports
Monthly reports provide a comprehensive analysis of your cloud spending over the previous month, enabling deeper trend analysis and budget tracking.
Key features of monthly cost reports include:
- Executive Summary: High-level overview with month-over-month comparison
- Key Highlights: Important trends and significant changes in your cloud spending
- Provider Breakdown: Detailed cost distribution across AWS and GCP
- Service-level Analysis: Comprehensive breakdown of costs by service with month-over-month changes
- Tag-based Cost Attribution: Costs organized by tags/labels for better department or project attribution
- Account/Project Analysis: Detailed cost breakdown by accounts (AWS) or projects (GCP)
Cost Report Sections
1. Executive Summary
The executive summary provides a high-level overview of your total cloud costs:
- Total cost for the period (daily or monthly)
- Comparison with the previous period
- Percentage change indicators
For monthly reports, key highlights section summarizes important trends:
- Overall cost increase/decrease percentage
- Major changes in provider costs (e.g., "AWS costs decreased by 4.81%")
- Significant service-level changes
2. Overall Cost Breakdown
This section breaks down costs by cloud provider:
- Cost by provider for the current period
- Cost by provider for the previous period
- Change percentage with color-coded indicators (green for decreases, red for increases)
3. AWS Costs
Detailed analysis of your AWS spending:
Top AWS Services
Lists your highest-cost AWS services, including:
- Service name (e.g., EC2, RDS, S3)
- Current period cost
- Previous period cost
- Percentage change with color indicators
Top AWS Services Analysis
Lists your highest-cost AWS services, including:
- Service name (e.g., EC2, RDS, S3)
- Current period cost
- Previous period cost
- Percentage change with color indicators
Top AWS Tags
Breaks down costs by AWS tags, allowing for better cost attribution by team, environment, project, etc.:
- Tag Key and Value pairs
- Cost associated with each tag combination
- Month-over-month change
Top AWS Accounts
Shows costs for your highest-spending AWS accounts:
- Account identifier and name
- Current period cost
- Previous period cost
- Percentage change
4. GCP Costs
Detailed analysis of your Google Cloud Platform spending:
Top GCP Services
Lists your highest-cost GCP services, including:
- Service name (e.g., Compute Engine, Cloud SQL)
- Current period cost
- Previous period cost
- Percentage change with color indicators
Top GCP Services
Lists your highest-cost GCP services, including:
- Service name (e.g., Compute Engine, Cloud SQL)
- Current period cost
- Previous period cost
- Percentage change with color indicators
Top GCP Tags
Breaks down costs by GCP labels, allowing for better cost attribution:
- Label Key and Value pairs
- Cost associated with each label combination
- Month-over-month change
Top GCP Projects
Shows costs for your highest-spending GCP projects:
- Project identifier
- Current period cost
- Previous period cost
- Percentage change
Report Delivery and Access
CloudYali cost reports are delivered via email to ensure team members stay informed without having to log in to a dashboard. Reports can be:
- Sent to multiple recipients or distribution lists
- (Coming Soon) Accessed historically through the CloudYali platform
Benefits of CloudYali Cost Reports
- Multi-cloud Visibility: Single consolidated view across AWS and GCP environments
- Proactive Cost Management: Quickly identify and address unexpected spending
- Team Awareness: Keep all stakeholders informed about cloud costs
- Cost Attribution: Understand which teams, projects, or environments drive costs
- Trend Analysis: Track spending patterns over time to inform budgeting
- Optimization Opportunities: Identify high-cost services and resources for optimization
Best Practices
- Review Reports Promptly: Get maximum value by checking cost reports as soon as they arrive
- Compare and Contrast: Use monthly reports to compare spending patterns with previous months
- Track Tags/Labels: Monitor the "Untagged" resource costs to identify gaps in your tagging strategy
- Share Insights: Distribute reports to both technical and finance stakeholders for better cross-team alignment
- Look for Trends: Pay attention to services or accounts showing consistent growth over time
- Investigate Spikes: Use daily reports to quickly identify and address unexpected cost increases
- Cross-Reference Reports: Compare daily findings with monthly trends for deeper insights
- Act on Opportunities: Use the cost data to drive your cloud tag governance and cost optimization initiatives
Next Steps
- Learn how to set up cost threshold alerts
- Explore AWS cost optimization strategies
- Discover GCP cost optimization techniques
- Implement cloud tag governance to improve cost attribution